German city names in the United States
Via zeit.de
Read MoreMaps of the US
Via zeit.de
Read More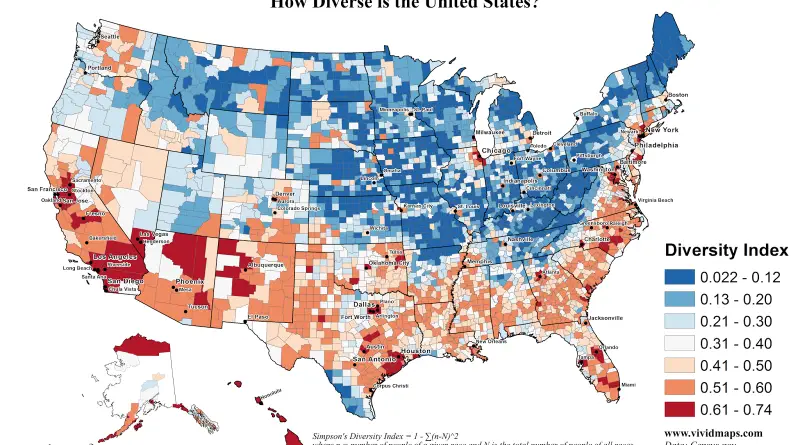
How Diverse is the U.S.? Via vividmaps.com County-level change in diversity since 2000 Via washingtonpost.com
Read MoreRelated posts: – The power of small U.S. states – 3D map of county-level election results – Geographically approximate, population-normalized
Read More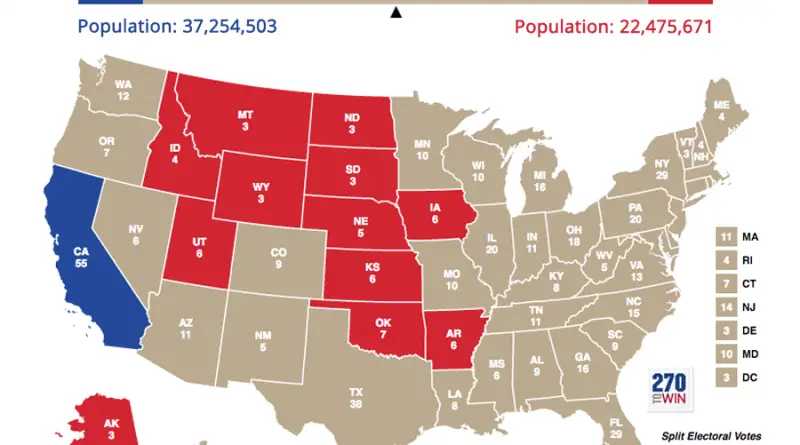
Related posts: – 3D map of county-level election results – Geographically approximate, population-normalized 2016 voting results using congressional districts –
Read More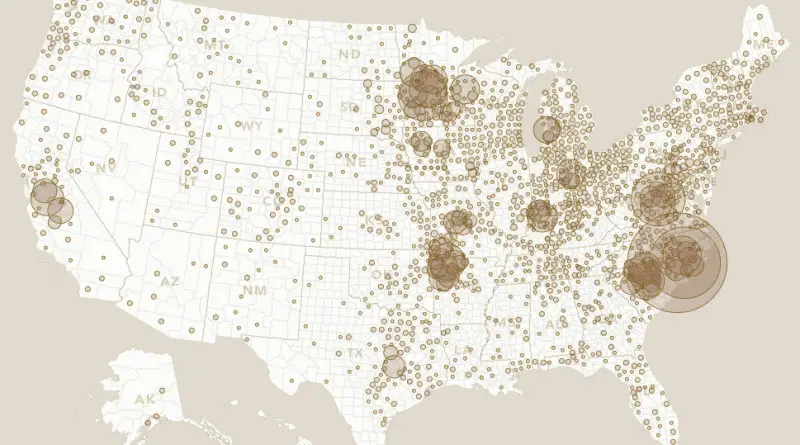
From the farm to your feast, take a look at where these four staples of the holiday meal may have originated
Read More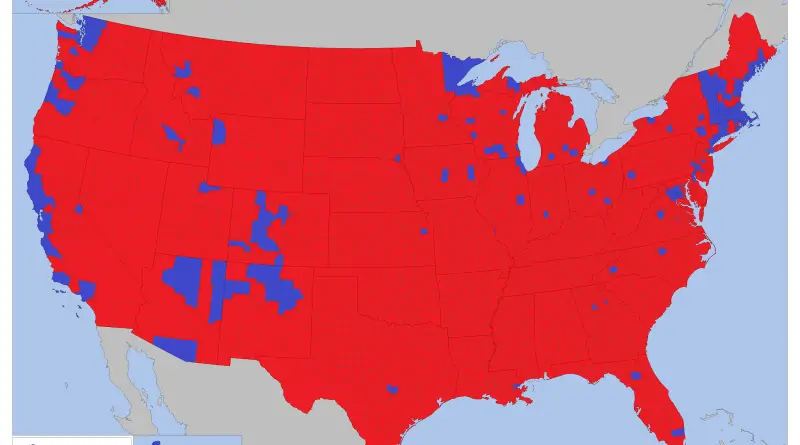
Via deviantart.net Related posts: – 3D map of county-level election results – Geographically approximate, population-normalized 2016 voting results using congressional
Read MoreVia fakeisthenewreal.org
Read More
Related post: – United States Old Maps
Read More