The Age Structure of the United States
The United States is one of the most populated nations in the world, following just behind China and India. A total population count of around 332 million inhabitants and a more-or-less constant population growth over the past decade show that the country has steadily enhanced its living conditions and standards.
Table of Contents
Population Pyramid
A population pyramid illustrates the age and sex structure of the country’s population and may provide insights into political and social stability and economic development. The nation’s population is distributed along the horizontal axis, with males displayed on the left and females on the right. The shape of the population pyramid slowly evolves over time based on fertility, mortality, and international migration movements. The shape of the American population pyramid shows a relatively stable population, with noticeable “bumps” for the Baby Boom generation and the generation of the “echo boom.”

Below is an animated America’s population pyramid over 100+ Years.
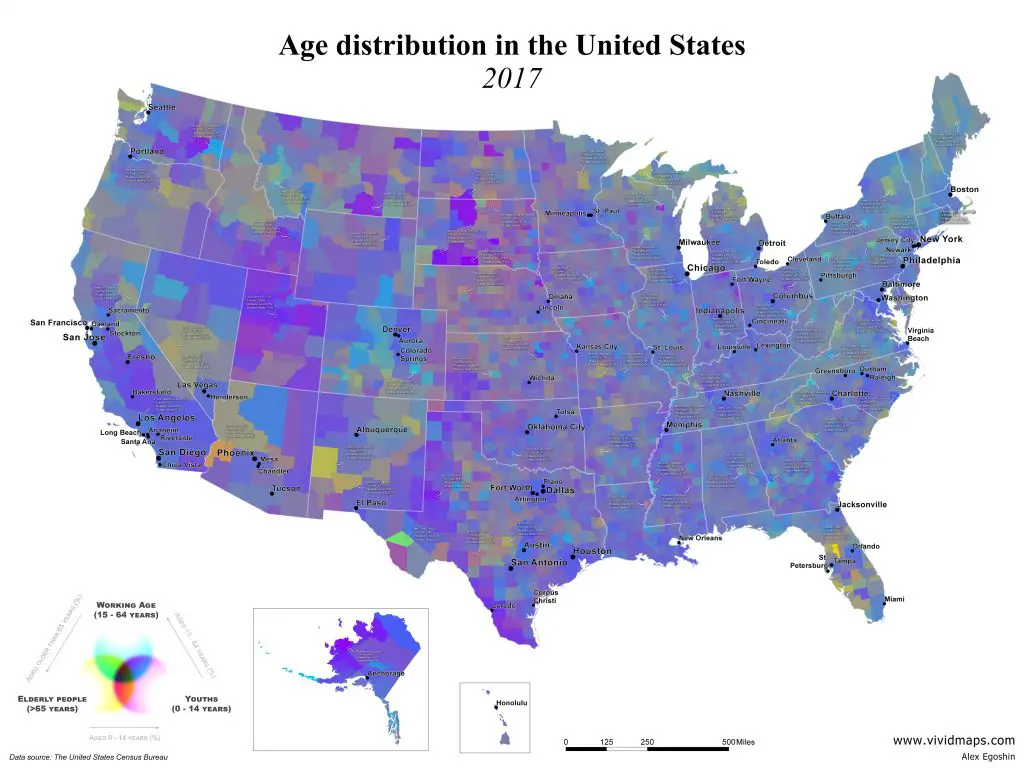
On the map below, each U.S. county’s population age composition in these maps is uniquely color-coded. Colors show the direction and magnitude of deviation from the center point, representing the average age composition. The hue component of color encodes the direction of deviation: towards yellow – more elderly population (65+); cyan – more people at working ages (15-64); magenta – more kids (<15).

The youngest counties in America (0-14 years)
- Wade Hampton (Alaska) – 35.42%
- Todd (South Dakota) – 35.21%
- Buffalo (South Dakota) – 33.57%
- Shannon (South Dakota) – 31.90%
- Dewey (South Dakota) – 31.74%
- Corson (South Dakota) – 31.05%
- Northwest Arctic (Alaska) – 30.99%
- Sioux (North Dakota) – 30.83%
- Thurston (Nebraska) – 30.39%
- Gaines (Texas) – 30.38%
U.S. counties with the highest working-age population (15-64 years)
- Aleutians West (Alaska) – 84.05%
- Aleutians East (Alaska) – 83.62%
- Radford (Virginia) – 80.43%
- Whitman (Washington) – 77.19%
- Riley (Kansas) – 76.56%
- Crowley (Colorado) – 76.56%
- Harrisonburg (Virginis) – 76.50%
- Chattahoochee (Georgia) – 76.31%
- Lexington (Virginia) – 76.19%
- Athens (Ohio) – 75.58%
The oldest counties in America (65+)
- Sumter (Florida) – 56.94%
- Catron (New Mexico) – 40.37%
- Charlotte (Florida) – 39.44%
- La Paz (Arizona) – 39.33%
- Kalawao (Hawaii) – 38.64%
- Sarasota (Florida) – 36.10%
- Northumberland (Virginia) – 35.99%
- Citrus (Florida) – 35.91%
- Alcona (Michigan) – 35.89%
- Llano (Taxa) – 35.61%
The evolution of the age structure of the United States
This statistic portrays the age distribution in the U.S. from 2011 to 2021. In 2021, about 18.24% of the U.S. population fell into the 0-14 year category, 64.72% into the 15-64 age group, and 17.04% were 65+.
Age distribution in the United States from 2011 to 2021 in percentage
| Age group | 2011 | 2012 | 2013 | 2014 | 2015 | 2016 | 2017 | 2018 | 2019 | 2020 | 2021 |
|---|---|---|---|---|---|---|---|---|---|---|---|
| 0-14 | 13.25 | 13.56 | 13.91 | 14.27 | 14.64 | 15.03 | 15.42 | 15.81 | 16.21 | 16.63 | 17.04 |
| 15-64 | 66.72 | 66.62 | 66.48 | 66.32 | 66.13 | 65.94 | 65.72 | 65.48 | 65.24 | 65.00 | 64.72 |
| 65+ | 20.03 | 19.82 | 19.62 | 19.42 | 19.22 | 19.02 | 18.86 | 18.71 | 18.55 | 18.37 | 18.24 |
According to the Census data, the country’s adult population grew faster than the underage-18 population and the American population as a whole in the last decade. Between 2020 and 2060, the number of older adults is forecasted to grow by 69%, from 56.0 million to 94.7 million. The number of people aged 85+ is projected to almost triple from 6.7 million in 2020 to 19 million by 2060.


