Animated maps

Animated mapsDemographyEthnic mapsNews

Understanding the U.S. Asian Population: A Comprehensive Overview

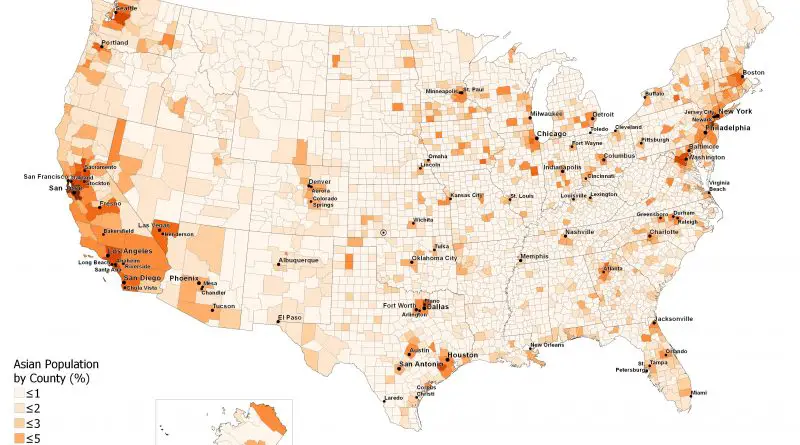
Asian Americans are a vibrant and diverse community, making up about 7.2% of the U.S. population. This article explores the ethnic composition, spatial distribution, and historical growth of Asian Americans, highlighting the areas with the highest and lowest concentrations. With detailed maps and animations, gain insights into the significant contributions and dynamic presence of Asian Americans across the United States.

Read More
Animated mapsEthnic mapsNewsVivid maps

Understanding the Black American Population: A Comprehensive Analysis

The Black American population is an integral part of the U.S., with significant contributions to the nation’s culture and history. This article explores the distribution, concentration, and changes in the Black population over time, highlighting states and counties with the highest numbers and percentages. Discover detailed insights supported by an animated map from 1990 to 2022.

Read More
Animated mapsInteractive mapsPopulation

The Population of Manhattan Mapped

In 2020, 1,694,251 people were living in Manhattan. The population density of this borough was about 72,918 people per square mile (28,154/km²). It is the highest population density of any county in the U.S. But this is not a record in the history of Manhattan. In 1910, at the height of European migration to New York, Manhattan’s population density peaked 101,548 people per square mile (39,208/km²).

Read More