Mapping sexual violence (2015 – 2016)
Global violence against women and sexual violence. Each dot on the map represents a location with at least 25 articles
Read more: Mapping sexual violence (2015 – 2016)Global violence against women and sexual violence. Each dot on the map represents a location with at least 25 articles
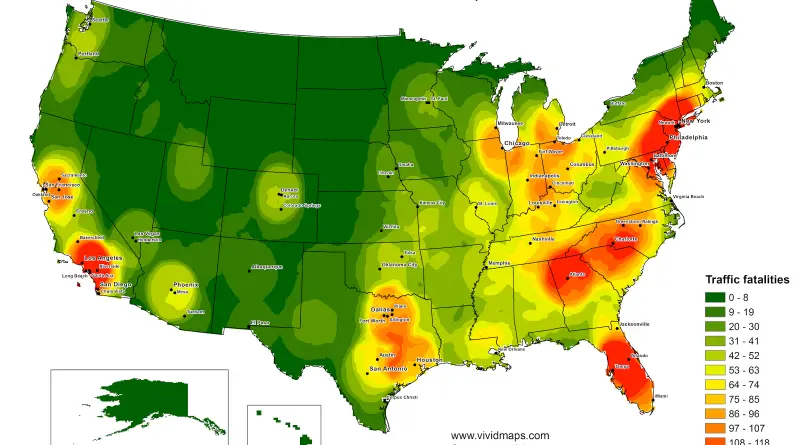
Read more: Mapping sexual violence (2015 – 2016)According to the National Highway Traffic Safety Administration (NHTSA), the US had a total of 38,680 traffic fatalities in 2020. This is a 7.2% increase from the 36,096 traffic fatalities reported in 2019.
Read more: United States Traffic Fatalities Heat MapSuicide is the act of intentionally causing one’s death. Risk factors encompass psychic disturbances such as depression, bipolar disorder, schizophrenia, personality disorders, or alcohol and drug addiction.
Read more: Suicide death rates mappedIn 2014, the nationwide jail incarceration rate of 326 per 100,000 county residents exceeded the highest county rates registered in
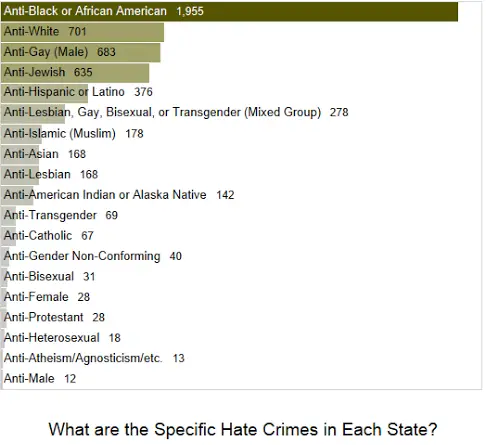
Read more: Jail incarceration rate per 100,000 U.S. county residentsWhich states have the most hate crimes? Via absentdata.com
Read more: F.B.I. Hate crime statisticsPrison belt stretching from Texas to Indiana. Via nytimes.com
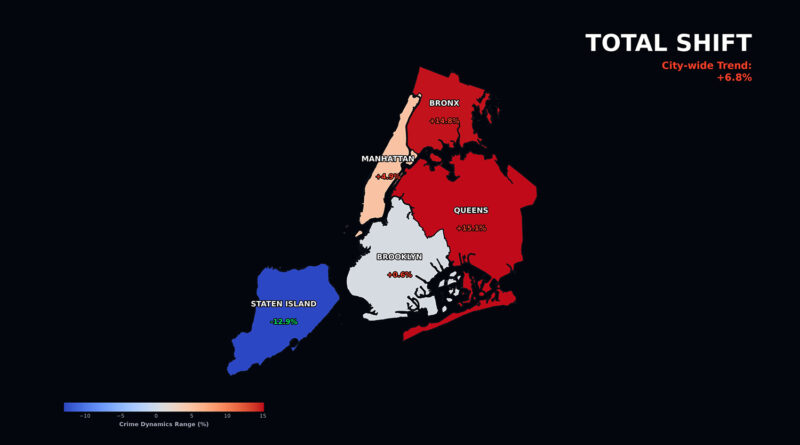
Read more: Where Americans are sent to prison most?NYC complaints fell almost every year from 2006 to 2020, then reversed hard. By 2024 the citywide total had passed its 2006 starting point, and four of the five boroughs now stand higher than they did 20 years ago.
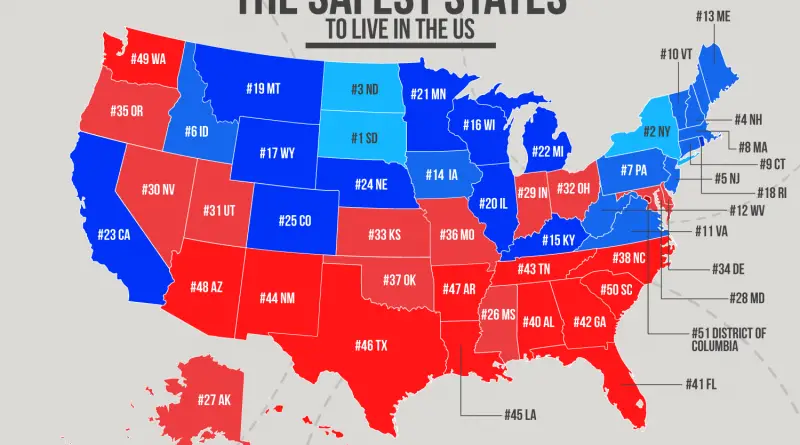
Read more: NYC Complaints Fell for a Decade, Then Passed 2006 LevelsThe data ranking is based on 10 years worth of data or The worse and the safest states to live
Read more: Ranking of the worse and the safest states to live in the U.S.Related post: – Australia … a big country
Read more: Australia it really is a big country