The Widening Income Gap in American Cities (1970 – 2015)
Since 1970, household incomes in American cities have seen a dramatic shift away from the middle toward the extremes. To
Read MoreMaps to explain economic geography.
Since 1970, household incomes in American cities have seen a dramatic shift away from the middle toward the extremes. To
Read MoreReddit user: eivarXlithuania
Read More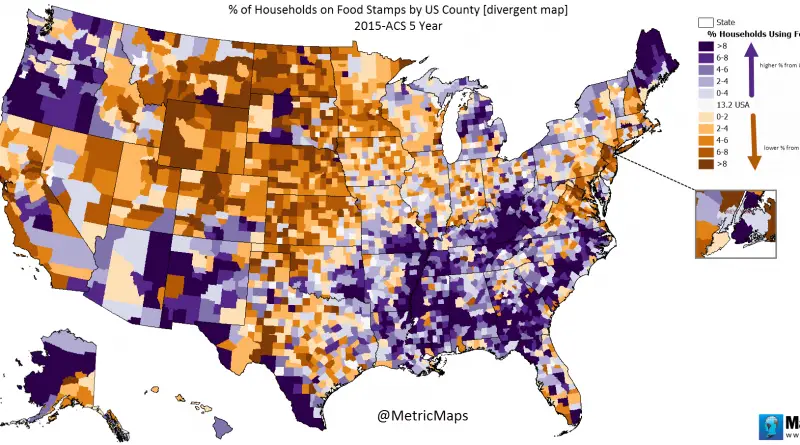
Source: www.metricmaps.org/2017/04/04/of-households-on-food-stamps-by-us-county
Read MoreDive into the economic realms of New York City and Europe’s key cities, uncovering the economic dynamics, figures, and comparisons that highlight their economic prowess and global impact.
Read More
The biggest the per-capita debt, the bigger the state. States with the biggest per-capita debt are at the center of
Read MoreCalifornia’s economy isn’t just big – it’s a global powerhouse that outperforms most nations. Let’s break down the numbers and see how the Golden State’s wealth spreads across its regions.
Read More
Via metricmaps.org
Read MoreEurope divided by LA’s GDP Los Angeles GDP nominal fitted in Africa Related post: – How many economies you can
Read More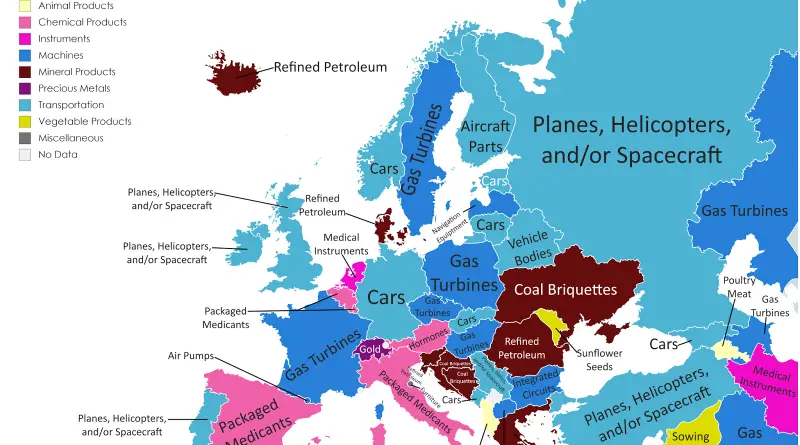
LA county GDP: $700 billion Population: 10 million
Read More