
Economic maps
Maps to explain economic geography.
Wealth in the U.S. (1872)
Related post: – United States Old Maps
Read more: Wealth in the U.S. (1872)The disappearance of San Francisco’s middle-class neighborhoods (1990 – 2010)
Related posts: – Mapping Displacement and Gentrification in the San Francisco Bay Area – America’s great housing divide: Are you
Read more: The disappearance of San Francisco’s middle-class neighborhoods (1990 – 2010)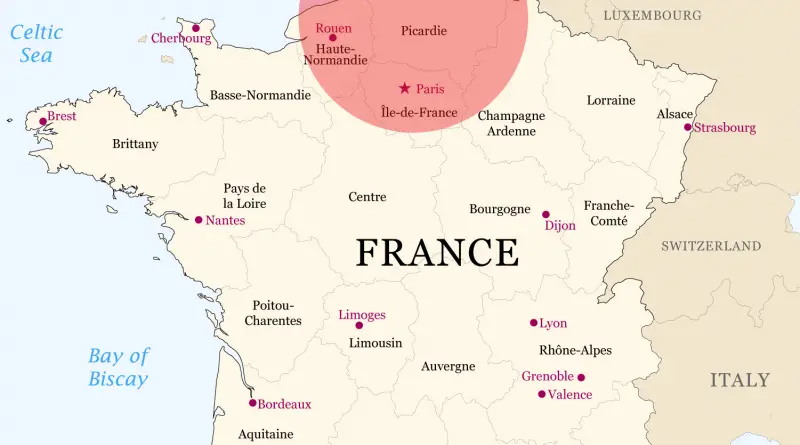

Unemployment in Italy
Italy has historically struggled with relatively high levels of unemployment, particularly in comparison to some of its European counterparts. Prior to the COVID-19 pandemic, the country had been grappling with unemployment rates that often exceeded the European Union average.
Read more: Unemployment in ItalyTipping etuquette around the world
U.S. In the U.S., tipping people in the service industry is a given. Restaurant servers, taxi drivers, hair stylists and
Read more: Tipping etuquette around the worldWorld Giving Index (2016)
World Giving Index shows Myanmar is most generous nation. 1. Myanmar2. USA3. Australia4. New Zealand5. Sri Lanka6. Canada7. Indonesia8. UK9.
Read more: World Giving Index (2016)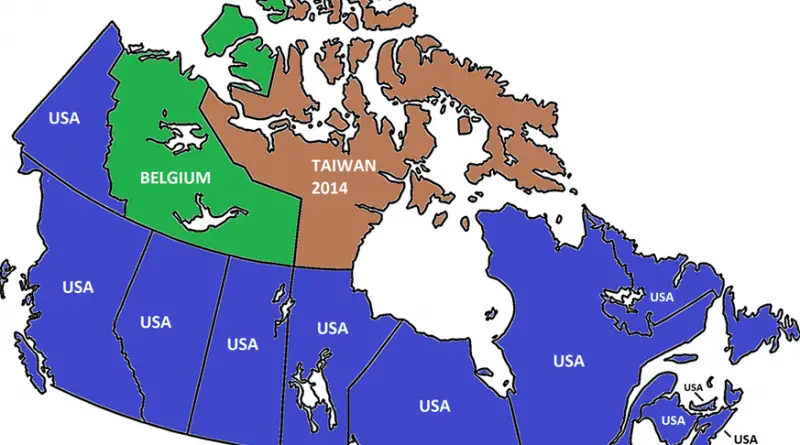
Which Countries Invest in the US?
1. Japan – $373 billion.2. Netherlands – $305 billion.3. Canada – $261 billion.4. Luxembourg – $243 billion.5. Germany – $224
Read more: Which Countries Invest in the US?America’s $18 Trillion Economy Explained in 3 Maps
America’s $18 trillion economy divided in half U.S. state borders redrawn and renamed for countries with GDPs Top 20 U.S.
Read more: America’s $18 Trillion Economy Explained in 3 MapsCountries grouped by United Nations
The maps below split all countries into four distinct categories: least developed countries, developing countries, economies in transition and developed
Read more: Countries grouped by United Nations