Disposable income of private households per capita (PPP)
Yearly income after taxes adjusted according to differences in price levels in different countries.
Read more: Disposable income of private households per capita (PPP)
Maps to explain economic geography.
Yearly income after taxes adjusted according to differences in price levels in different countries.
Read more: Disposable income of private households per capita (PPP)France is one of the significant agricultural powers, with about 25 percent of the whole farming products of the European Union being produced there. The contribution of the farming sector to the country’s gross domestic product (GDP) is about 2.5 percent. The French government gives substantial support to its agricultural industry to continue growing and contributing to its GDP, which will more guarantee increased export activities.
Read more: French-foreign trade in mapsRelative value of $100 based on National Average Via economist.com Related post: – The relative value of $100: Which state
Read more: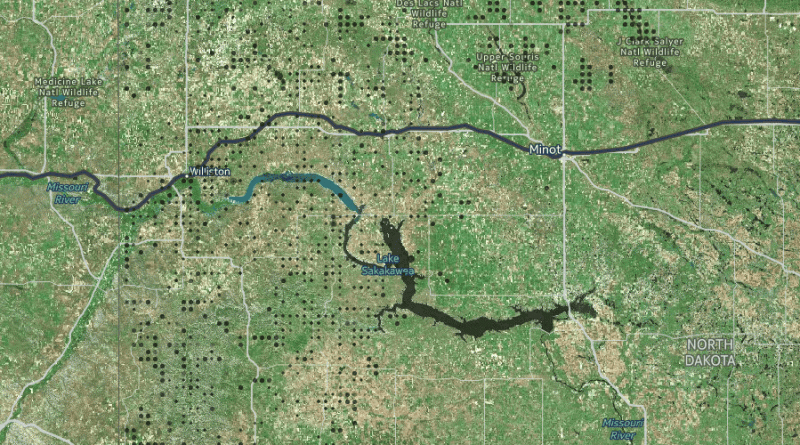
What’s next for North Dakota? Public data reveals dwindling economic opportunity for the state despite recent record levels of oil
Read more: North Dakota: Oil Boom and Bust– In 2014, the U.S. Department of Agriculture estimated that 14 percent of U.S. households were classified as food insecure,
Read more: Percentage of households that are food in secure– Areas around transit stations are changing and that many of the changes are in direction of neighborhood upscaling and
Read more: Mapping Gentrification in Los AngelesSource: http://simd.scot/2016/#/simd2016/BTTTFTT/7/-3.8573/57.3959/
Read more: Scottish Index of Multiple Deprivation (2016)A: Upper middle class. Higher managerial, professional or administrative jobs (4% of the total population, 2008). B: Middle class. Intermediate
Read more: Percentage of middle-class people in England & Wales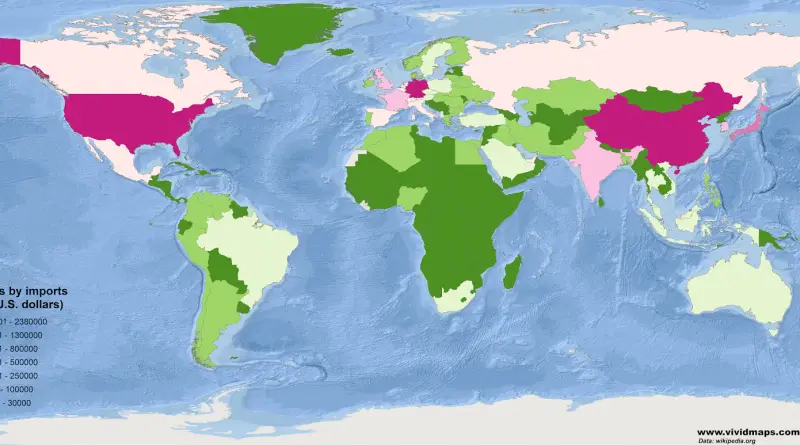
An import is a good brought into a jurisdiction, especially across a national border, from an external source. The party
Read more: Countries by ImportsTop Countries by Inbound Tourism Expenditure – United States: $220.1B – France: $66.8B – Spain: $65.1B – United Kingdom: $62.8B
Read more: Inbound and Outbound Tourism Expenditure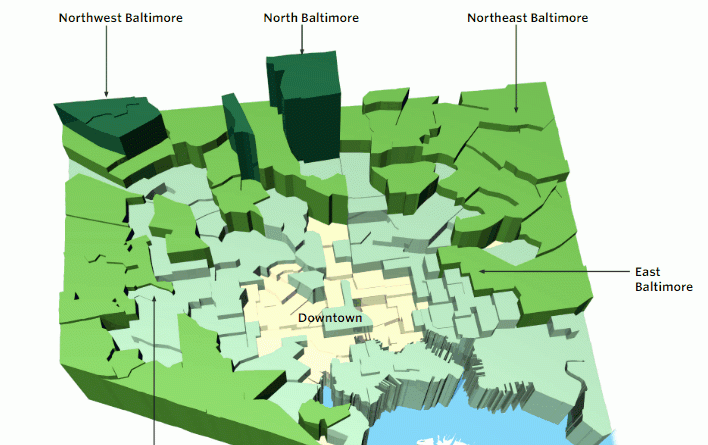
The middle class in the United States has shrunk since 2000. Stateline analysis reveals that in all 50 states, the
Read more: What’s happened to the middle class?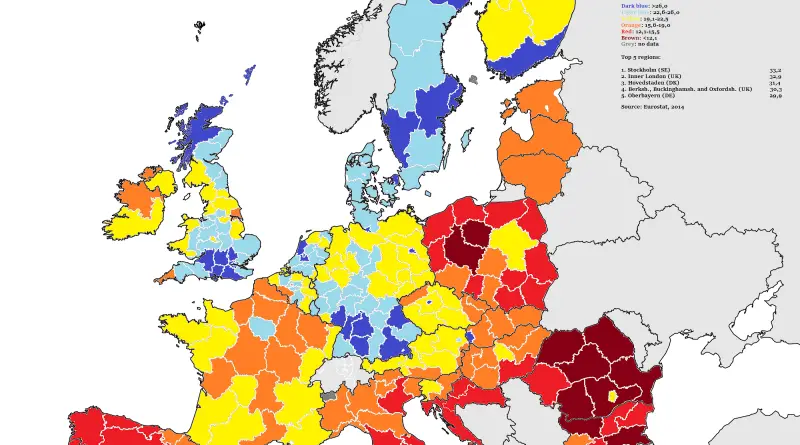
High-tech manufacturing includes pharmaceuticals and electronics, while medium-high-tech manufacturing includes chemicals, electric equipment and transportations. Knowledge-intensive services (KIS) include a
Read more: % of people employed in high- & middle-heigh-tech manufacturing and knowlege-intensive services