Interactive maps
Soundscore: find out how loud your new neighborhood will be before you move in
A Soundscore rating aggregates environmental noise caused by vehicle traffic, airplane traffic and local sources. A Soundscore rating is a
Read MoreConnectivity Atlas
Infrastructure connects and defines us. The roads, pipelines and Internet cables that deliver our services also shape our opportunities, our
Read MoreImmigration in France
The percentage of immigrants in each French canton.
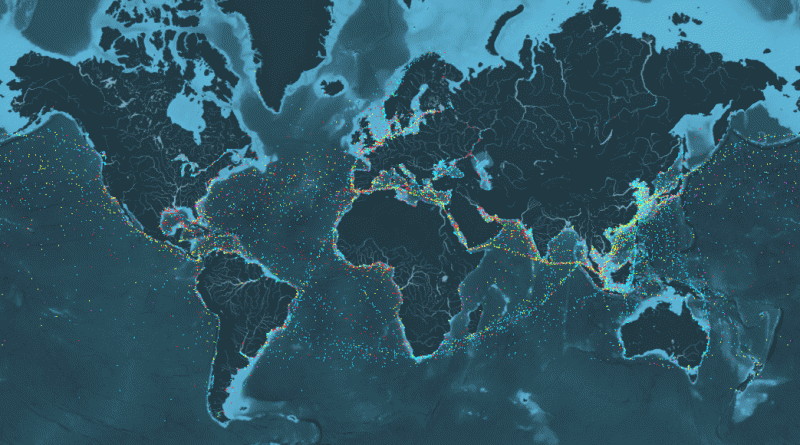
Read MoreAn incredible visualisation of global shipping traffic
What can I see? You can see movements of the global merchant fleet over the course of 2012, overlaid on
Read MoreCosmic Web Visualization
“The concept of the cosmic web—viewing the universe as a set of discrete galaxies held together by gravity – is
Read MoreInternational Science Ranking
Science is a systematic enterprise that creates, builds and organizes knowledge in the form of testable explanations and predictions about
Read MoreNew York Citi Bike Rebalancing Study
This study focuses on a few of the most intractable problems that any robust bikeshare network faces: rebalancing stations so
Read MoreBicycle Stress Map
This map shows the levels of traffic stress that people who bicycle experience on each public road (excluding freeways) and
Read MoreA new view of the tree of life
The tree includes 92 named bacterial phyla, 26 archaeal phyla and all five of the Eukaryotic supergroups. Major lineages are
Read More
