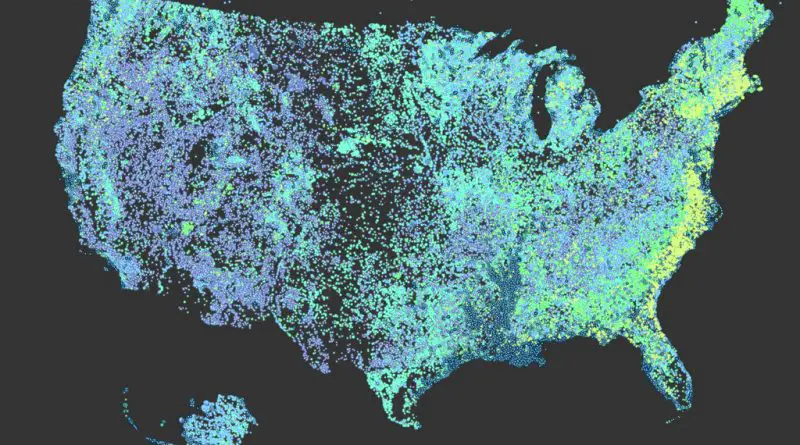
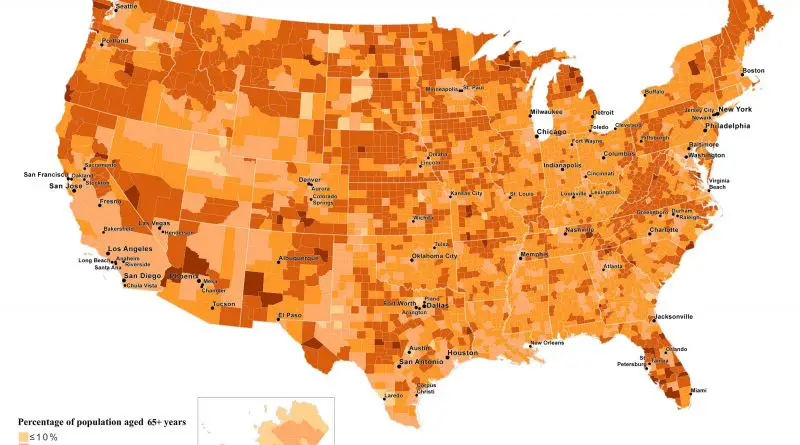
U.S. Non-Hispanic White Population by County (1990 – 2017)
In 2011, for the first time in United States history, non-Hispanic whites accounted for under half of the births in
Read MoreIn 2011, for the first time in United States history, non-Hispanic whites accounted for under half of the births in
Read MorePopulation density has been monitored for more than 200 years in the U.S. During this time, the number of people living in the U.S. per square mile has grown from 4.5 in 1790 to 87.4 in 2010. Nowadays, the population density in the United States is 87 per square mile.
Read MoreDive into the intriguing realm of global road networks as we unveil the countries with the highest road density. Our world maps showcase not just current leaders but also the nations experiencing rapid growth in their road infrastructure.
Read MoreFollow the fascinating transformation of America’s religious landscape through detailed county-level maps spanning 120 years. Using historical data and modern visualization techniques, these maps reveal the changing patterns of religious diversity across the United States.
Read MoreBy analyzing climate conditions and settlement patterns worldwide, this study shows which countries offer the most land area suitable for comfortable human habitation, with Brazil leading the list.
Read MoreIn 1900, reaching 65 was a rare achievement. Today, most of us will celebrate our 65th birthday and beyond. But this remarkable change hasn’t happened equally for everyone – here’s what our maps reveal about who lives longer, where, and why.
Read MoreJourney through America’s loftiest and lowest railway stations, uncovering the histories of the Pikes Peak Cog Railway, the Leadville Railroad, Amtrak’s highest and lowest stations, and the rich legacy and future of U.S. railroads.
Read MoreExplore the religious landscape of the U.S. from 1890 to 2010 through maps I created using ARDA data. See how religion has shaped different areas over time.
Read MoreHow safe is your state? Our analysis of the 2025 U.S. News & World Report public safety rankings uncovers unexpected trends across America. Through interactive maps, we discover why New England tops the safest states and some others struggle with ongoing problems.
Read MorePopulation density of adherents of religions, 1890 – 2010 Population density of adherents, 2010 Alex Egoshin, www.vividmaps.com Related posts:– Faithland
Read More