The percentage of Jews in the U.S. (1980 – 2010)
Jews as a percentage of all residents, 1980 – 2010 Youtube Jews as a percentage of all residents, 2010 Most
Read more: The percentage of Jews in the U.S. (1980 – 2010)

Jews as a percentage of all residents, 1980 – 2010 Youtube Jews as a percentage of all residents, 2010 Most
Read more: The percentage of Jews in the U.S. (1980 – 2010)U.S. states and UK regions, which has a similar population density. Reddit user: trampolinebears Population density of the countries of
Read more: Population density of United States with United Kingdom equivalentsCatholics as a percentage of all residents (1890 – 2010) Catholics as a percentage of all residents (2010) Most Catholic States
Read more: The percentage of Catholics in the U.S. (1890 – 2010)

Muslims as a percentage of all residents, 1980 – 2010 YouTube version of the map Muslims as a percentage of
Read more: The percentage of Muslims in the U.S. (1980 – 2010)
A number of adherents per congregation (1890 – 2010) Youtube A number of adherents per congregation, 2010 www.vividmaps.com Related post:
Read more: A number of adherents per congregation by U.S. county (1890 – 2010)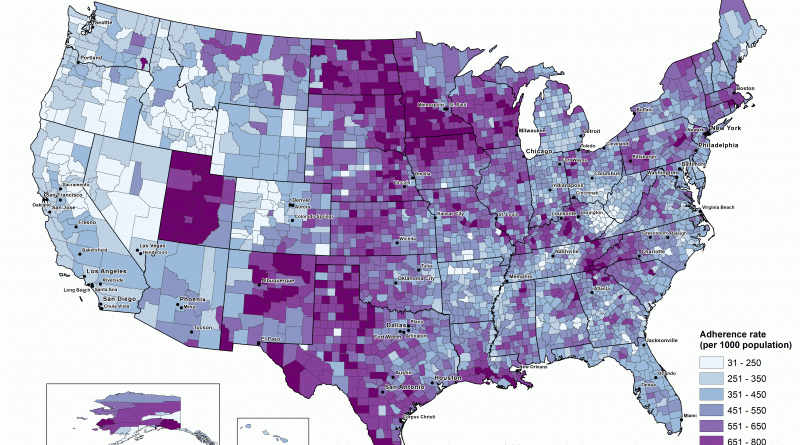
Total religious adherents by county, 1890 – 2010 Youtube Total religious adherents by county, 2010 www.vividmaps.com Related post: – Religious
Read more: Total religious adherents by U.S. county (1890 – 2010)Social scientists have used the Gini coefficient as the most common measure of global inequality (the income or wealth distribution of a nation’s residents). It was developed by the Italian statistician and sociologist Corrado Gini and published in 1912. A Gini coefficient of zero expresses perfect equality, where everyone has the same income. A Gini coefficient of 1 (or 100%) expresses maximal inequality among peoples.
Read more: Inequality Around the World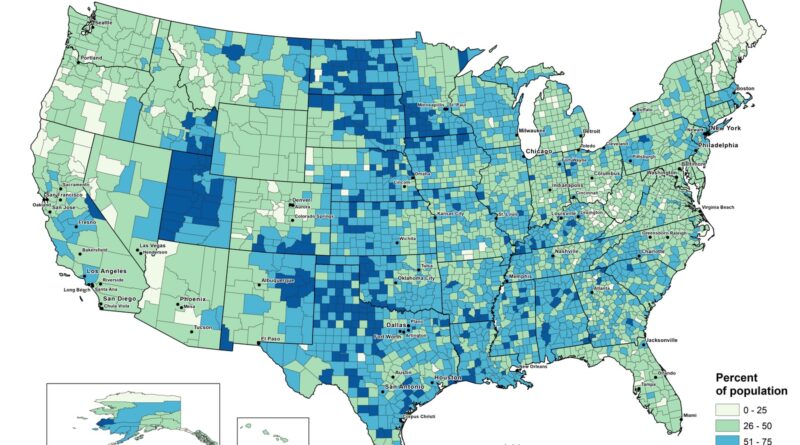
Religious adherence as a percentage of all residents (2010) Religious adherence as a percentage of all residents (1890 – 2010)
Read more: Religious adherence as a percentage of all residents (1890 – 2010)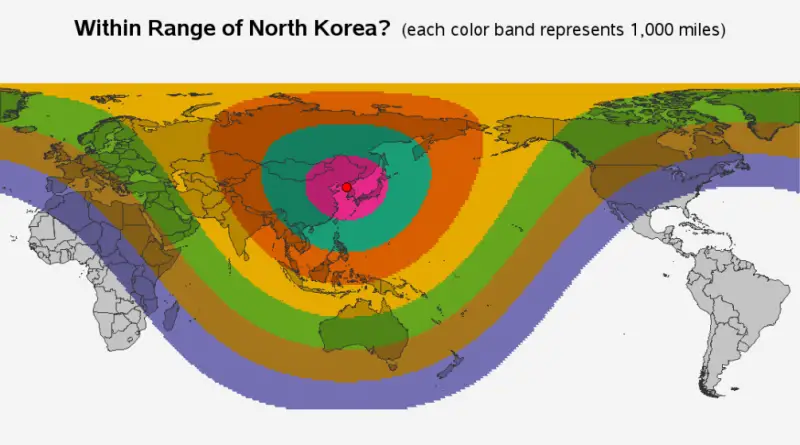
Within range of North Korea? (each color band represents 1,000 miles) Source: robslink.com Map of North Korea’s ICBM range. Source:
Read more: Are you within range of North Korea?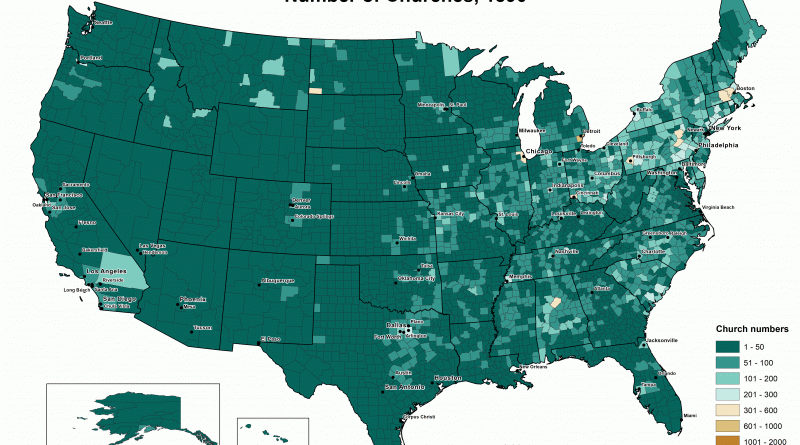
Number of congregations by county (1890 – 2010) Youtube version Number of congregations, by US county (2010) www.vividmaps.com Related post:
Read more: Number of congregations by U.S. county (1890 – 2010)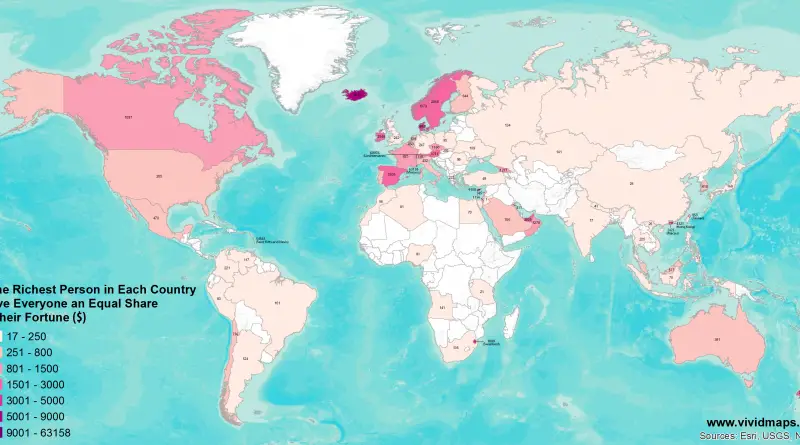
www.vividmaps.com Related post: – If the Richest Person in Each US State Gave Everyone an Equal Share of their Fortune
Read more: If the Richest Billionaire in Each Country Gave Everyone an Equal Share of their Fortune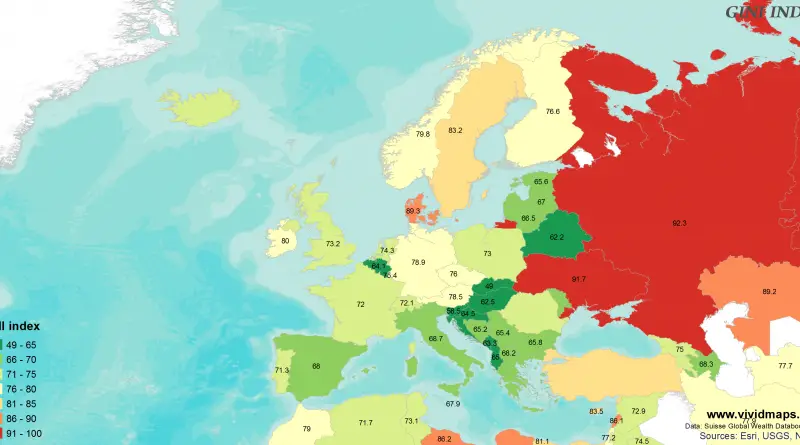
Gini index is a measure of statistical dispersion intended to represent the income or wealth distribution of a nation’s residents
Read more: Inequality in Europe