Global vertical gravity gradient visualisation
A new version of the global vertical gravity gradient (map, recently published in the journal ‘Science’, shows unprecedented detail, helping
Read MoreA new version of the global vertical gravity gradient (map, recently published in the journal ‘Science’, shows unprecedented detail, helping
Read MoreMapping how the UK and (other) EU citizen move between the United Kingdom and the rest of the European Union.
Read MorePrecipitation varies significantly across the U.S. Late summer and autumn tropical cyclones bring rain, dropping across the Atlantic states and Gulf area. In winter and spring, Pacific storm systems get Hawaii and the western U.S. states most precipitation. Low-pressure moving up the U.S.’s eastern shore brings cold season precipitation to the Mid-West and Northeast U.S. states.
Read MoreLondon traffic counts map showing raw counts for one hour (8am-9am) on one day each year. The circle colors show
Read MoreThe 500 Cities project is a collaboration between CDC, the Robert Wood Johnson Foundation, and the CDC Foundation. The purpose
Read More1550 Map of North and South America labeled in German. Geographic features otherwise in Latin.
Read MoreFrom 1933 to 2017, the global Jewish population experienced significant changes due to historical events, including the Holocaust, migration, and natural population growth.
Read MoreThe data EWG used are drawn from a 2009 EPA study that analyzed “regional patterns of dependence on intermittent, ephemeral
Read More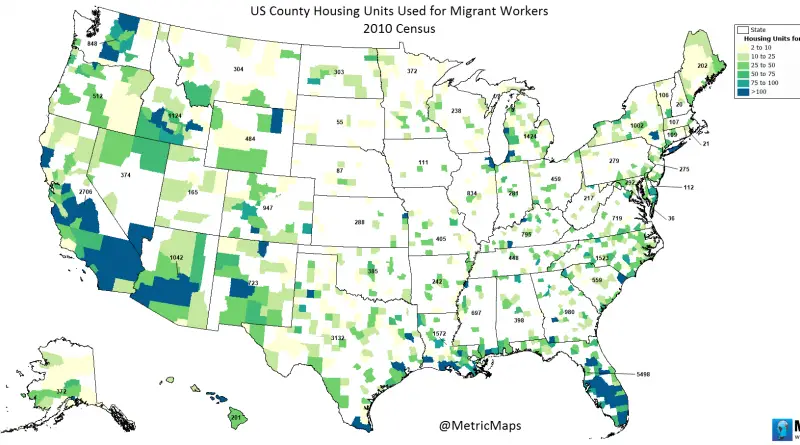
www.metricmaps.org/2017/03/02/us-county-housing-units-used-for-migrant-workers
Read More