From 4.5 Million to 8 Billion: How Earth’s Population Changed Over 12,000 Years
At some point in late 2022, Earth’s population crossed eight billion. The number is significant partly for its size, but mostly for what it took to get there.
Population has never moved in a straight line. Pandemics hollowed out cities in weeks. Colonization nearly erased entire continents. The Industrial Revolution compressed what should have been centuries of growth into a few decades.
10,000 BCE
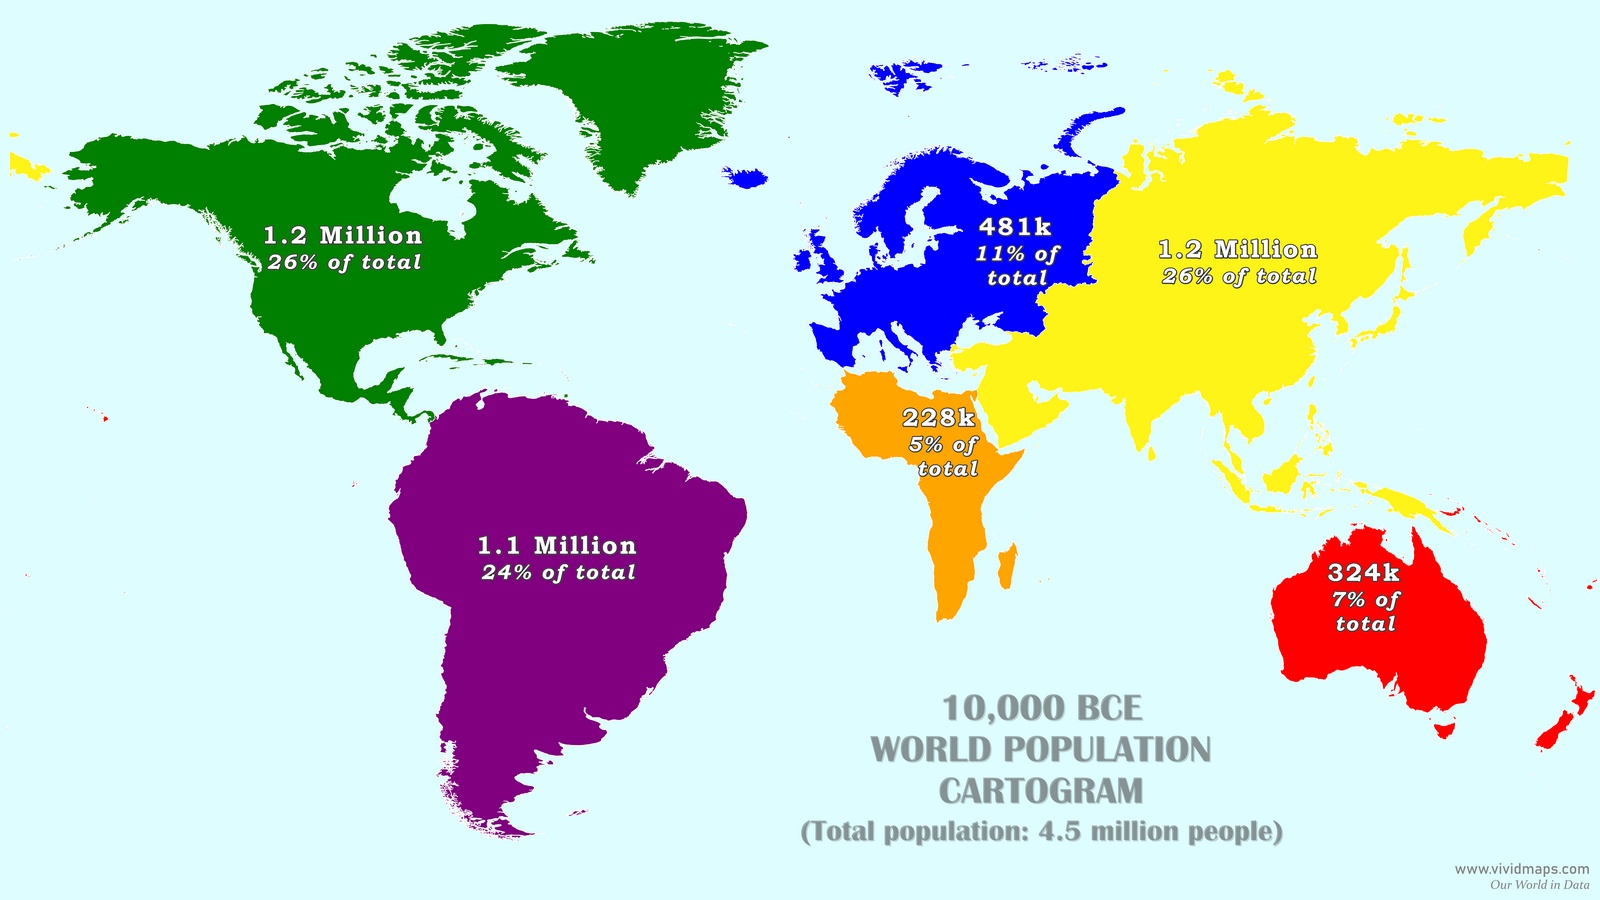
The 10,000 BCE map created puts 26% of all humanity in North America and another 24% in South America. Half the world in the Americas!
The total global population was 4.5 million. Europe, for all its land area, held only 481,000 people. Africa, despite being where our species spent its first hundred thousand years, had just 228,000. There were no cities anywhere. Most people were hunter-gatherers, spread in small bands across six inhabited continents — and the two largest concentrations were in the Americas.
The Plague of Justinian (541–549 CE)
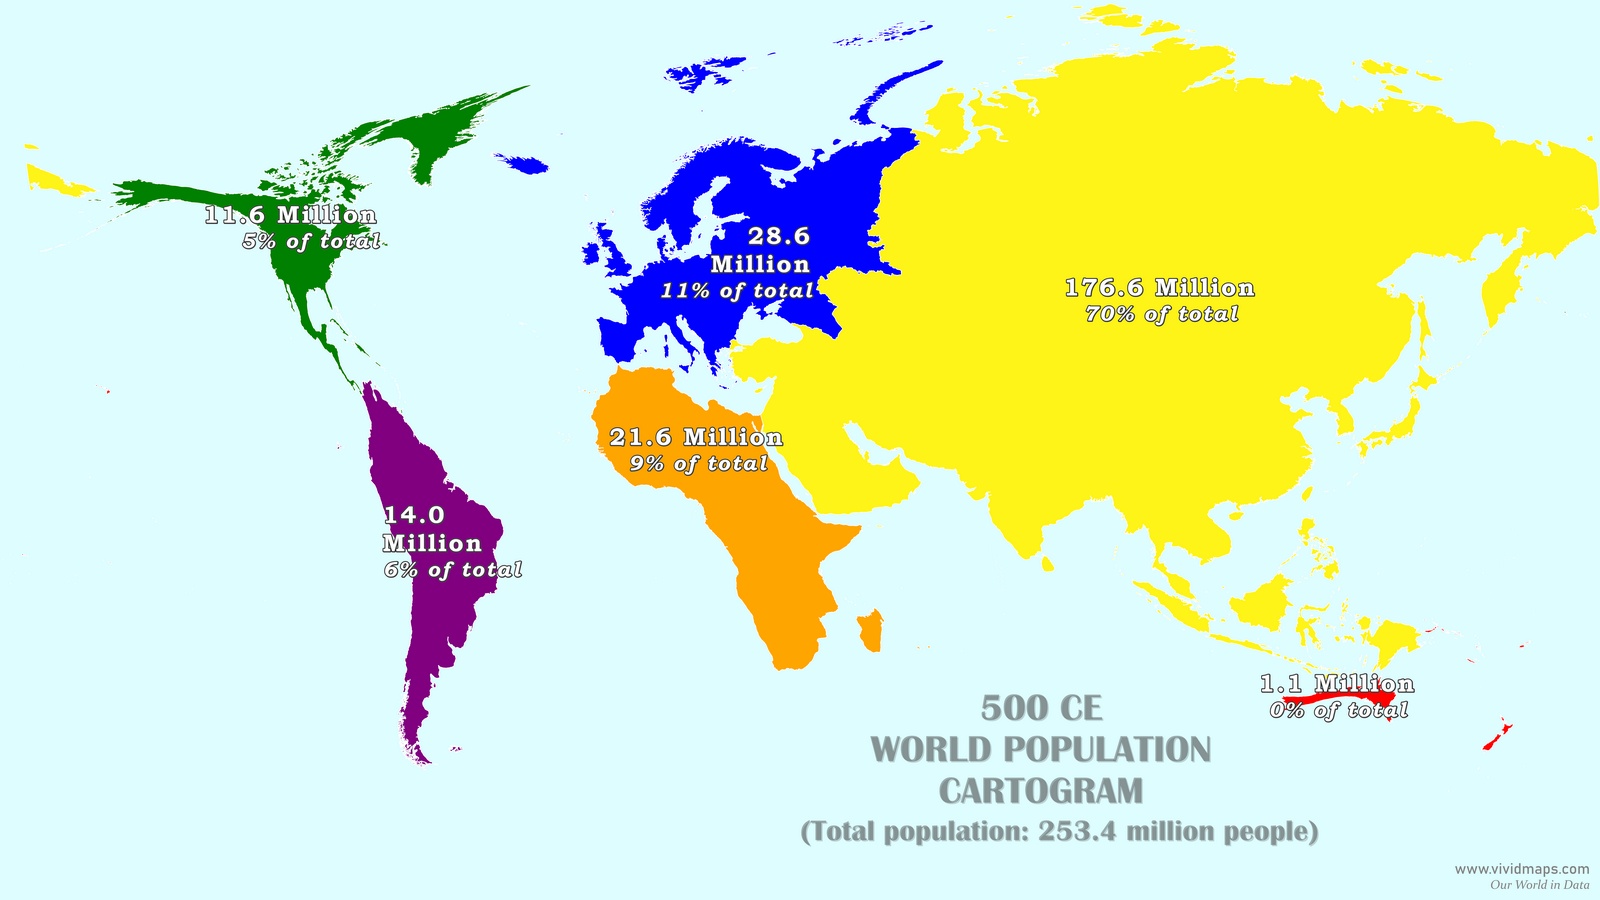
500 CE. The world holds 253.4 million people, and 70% of them live in Asia — 176.6 million, accumulated over thousands of years in the river valleys running from the Indian subcontinent east to China. In 541, that changed.
Emperor Justinian himself caught the plague and survived, which is how it got its name. Byzantine chroniclers recorded between 5,000 and 10,000 deaths per day in Constantinople at the outbreak’s height, with mass graves filling faster than gravediggers could keep pace. Historians still argue about the exact figures. What nobody disputes is that nothing in any earlier written record comes anywhere close.
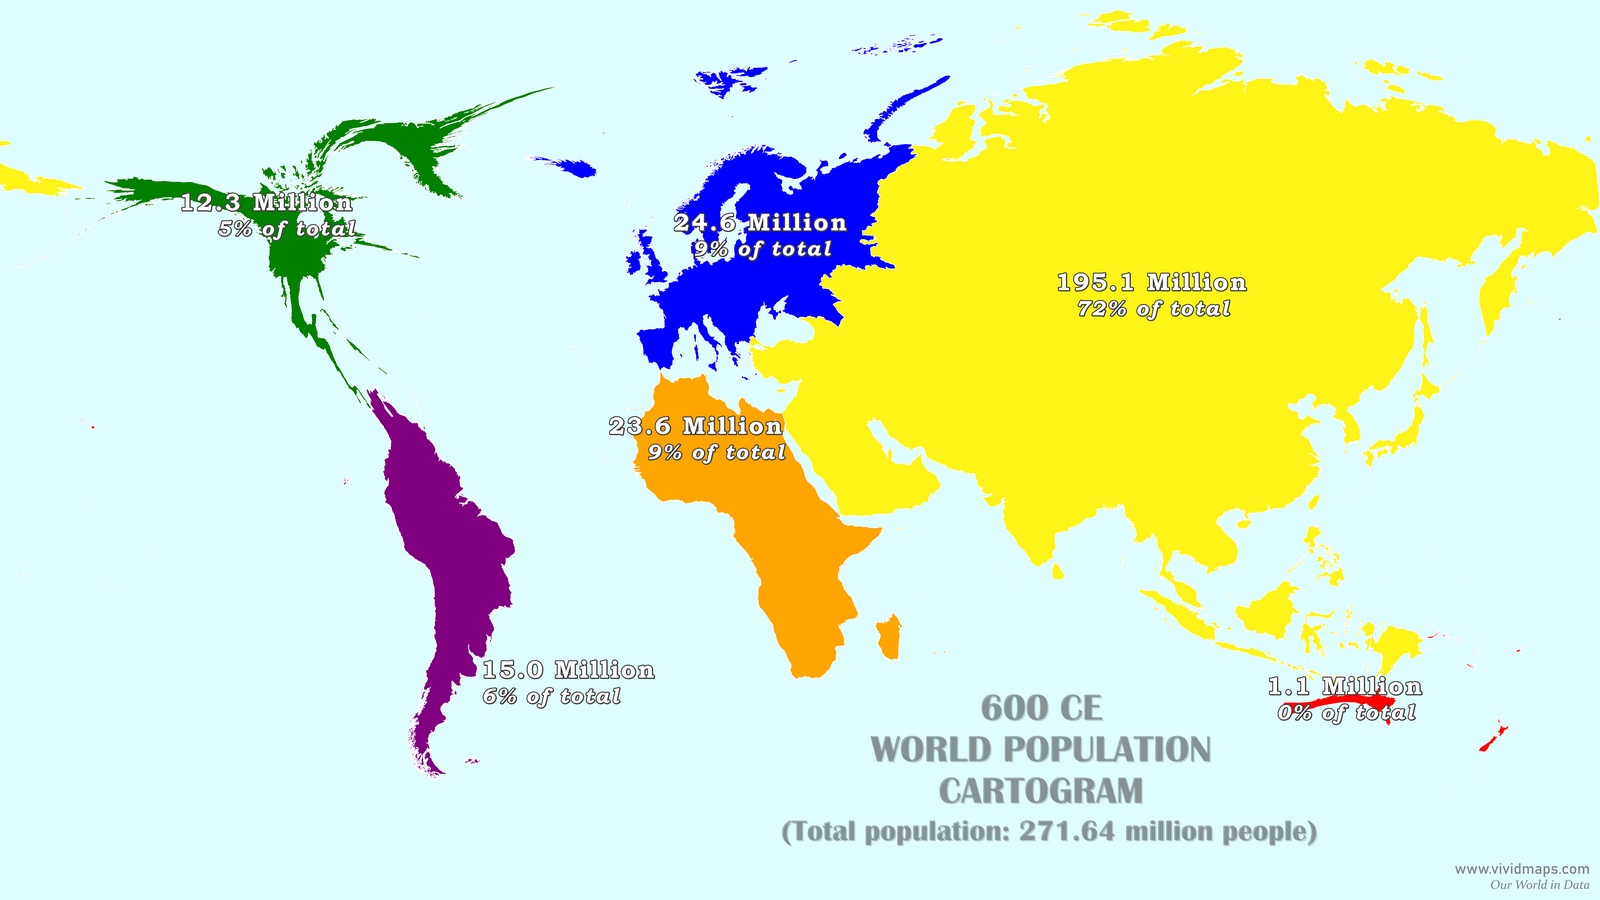
The pathogen killed most efficiently where merchants and travellers crossed paths — ports, market towns, the roads connecting them. Rural Asia sat largely outside those networks and was mostly spared. Europe’s count fell from 28.6 million to 24.6 million by 600 CE. Alexandria and Antioch had been Mediterranean commercial anchors for centuries before 541; both shrank after it and never returned to their earlier scale. Asia grew from 176.6 million to 195.1 million.
| Continent | 500 CE | Share | 600 CE | Share | Change |
|---|---|---|---|---|---|
| North America | 11.6M | 5% | 12.3M | 5% | +6.0% |
| South America | 14.0M | 6% | 15.0M | 6% | +7.1% |
| Europe | 28.6M | 11% | 24.6M | 9% | −14.0% |
| Africa | 21.6M | 9% | 23.6M | 9% | +9.3% |
| Asia | 176.6M | 70% | 195.1M | 72% | +10.5% |
| Oceania | 1.1M | 0% | 1.1M | 0% | 0.0% |
| World | 253.4M | 271.6M | +7.2% |
A century after the outbreak, 18 million more people were alive globally than in 500 CE. The regions the plague couldn’t reach had kept adding up. The Byzantine Empire was a different matter — it never recovered the territorial control it had held before 541.
The Black Death (1347–1351)
In 1347, Yersinia pestis was back. The death toll over the following four years was on a scale the Justinianic outbreak never reached. Between a third and more than half of Europe’s entire population died. Some regions lost close to three-quarters of their people in under four years.
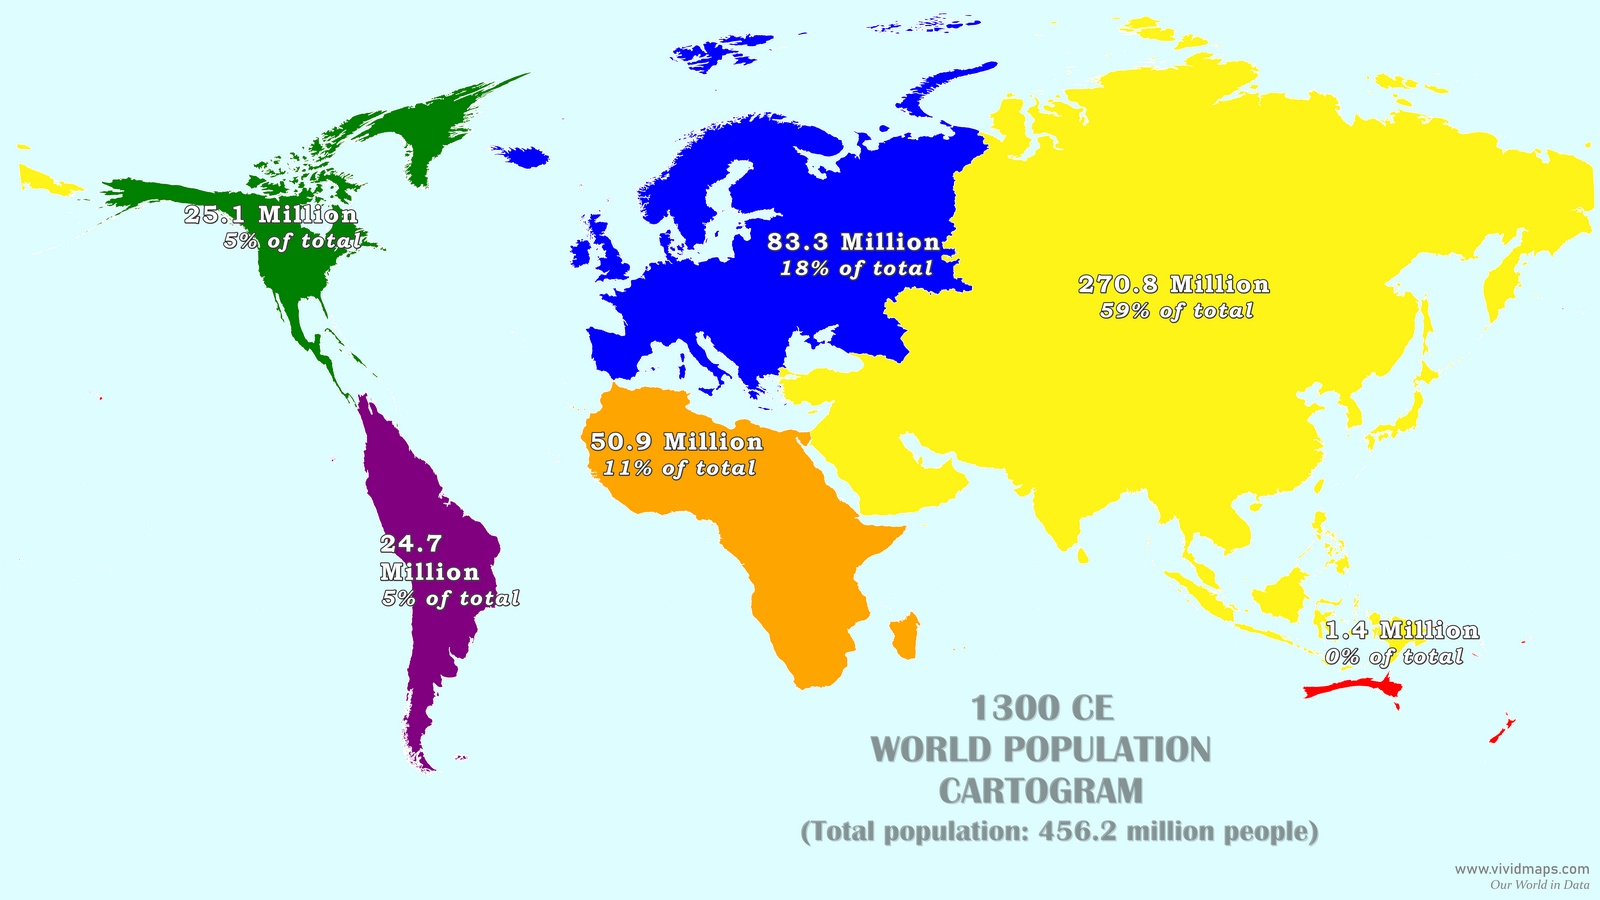
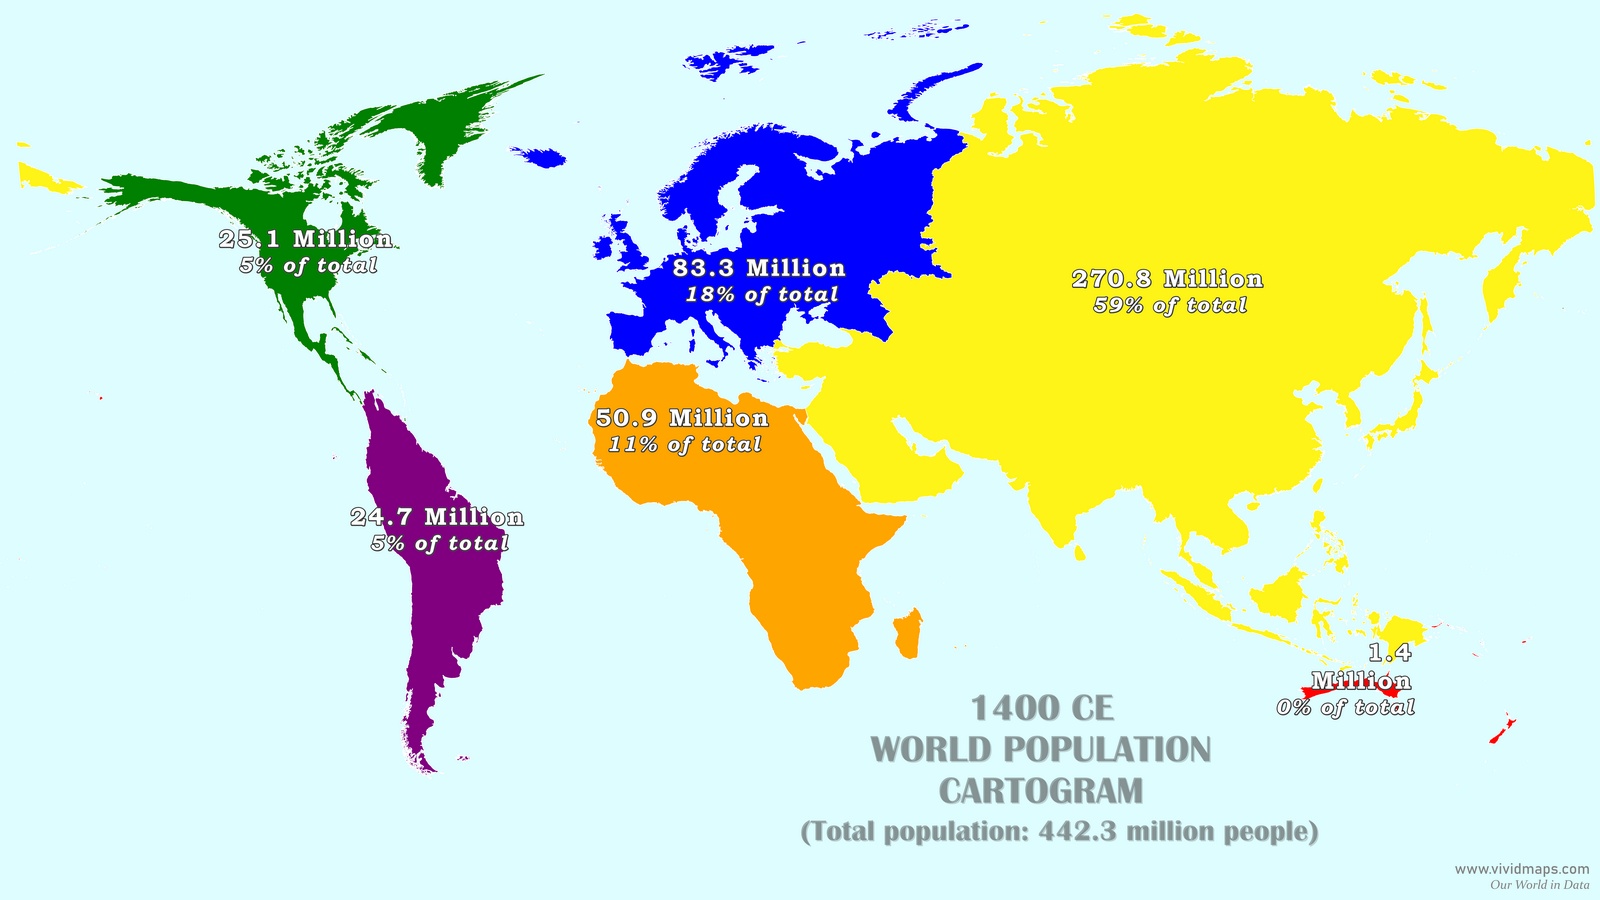
In 1300, the world held 456.2 million people. Asia stood at 279.8 million (59%). Europe had grown to 83.3 million, 18% of the global total, built on centuries of agricultural expansion and slow urban growth. The Americas, still entirely cut off from Old World pathogens, held around 50 million people combined.
By 1400, the world total had fallen to 442.3 million and Asia’s count had dropped from 279.8 to 270.8 million. Parts of England, France, and Italy lost between a third and half their people in a matter of years. Whole villages were abandoned. The labour shortages that followed broke open power relationships across Europe that had held for generations.
| Continent | 1300 CE | Share | 1400 CE | Share | Change |
|---|---|---|---|---|---|
| North America | 25.1M | 5% | 25.1M | 5% | 0.0% |
| South America | 24.7M | 5% | 24.7M | 5% | 0.0% |
| Europe | 83.3M | 18% | 83.3M | 18% | 0.0% |
| Africa | 50.9M | 11% | 50.9M | 11% | 0.0% |
| Asia | 279.8M | 59% | 270.8M | 61% | −3.2% |
| Oceania | 1.4M | 0% | 1.4M | 0% | 0.0% |
| World | 456.2M | 442.3M | −3.0% |
A net global decline of 3%. Unremarkable in percentage terms, historically significant as the first recorded instance of world population going backward, produced by a single pathogen moving along trade routes. The effects on European society outlasted the pandemic by centuries. The Church’s authority over ordinary life weakened sharply in the aftermath. Landowners who had never negotiated wages found themselves with no leverage. The intellectual response to the Black Death fed directly into the medical and philosophical shifts of the Renaissance. Population event and civilizational turning point — the two are genuinely hard to separate here.
The Americas, 1492–1600
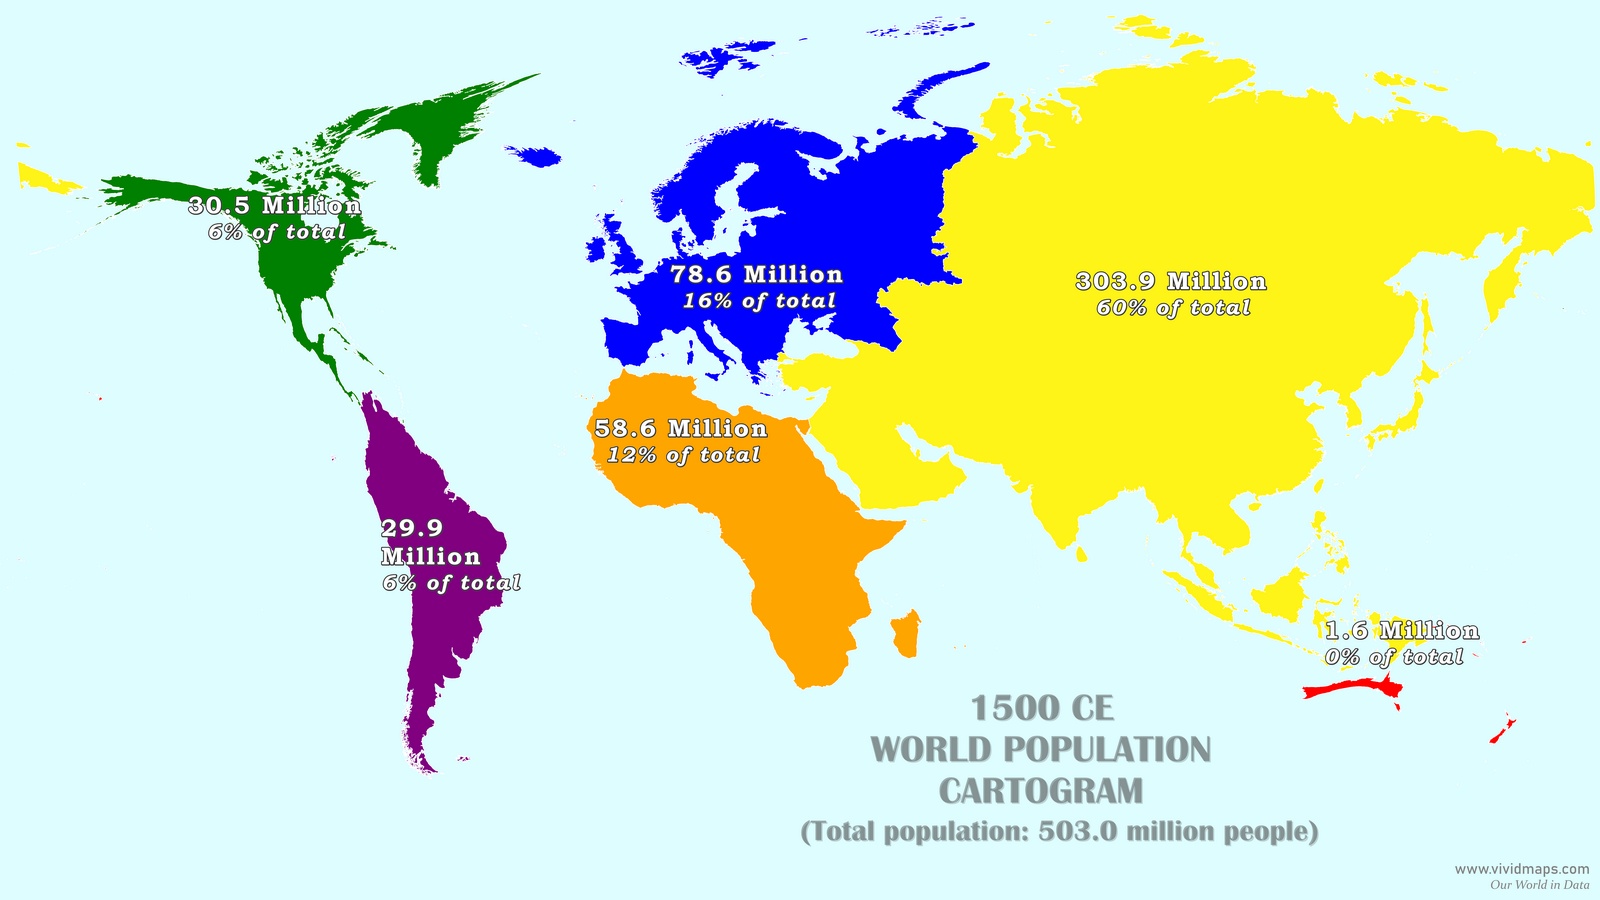
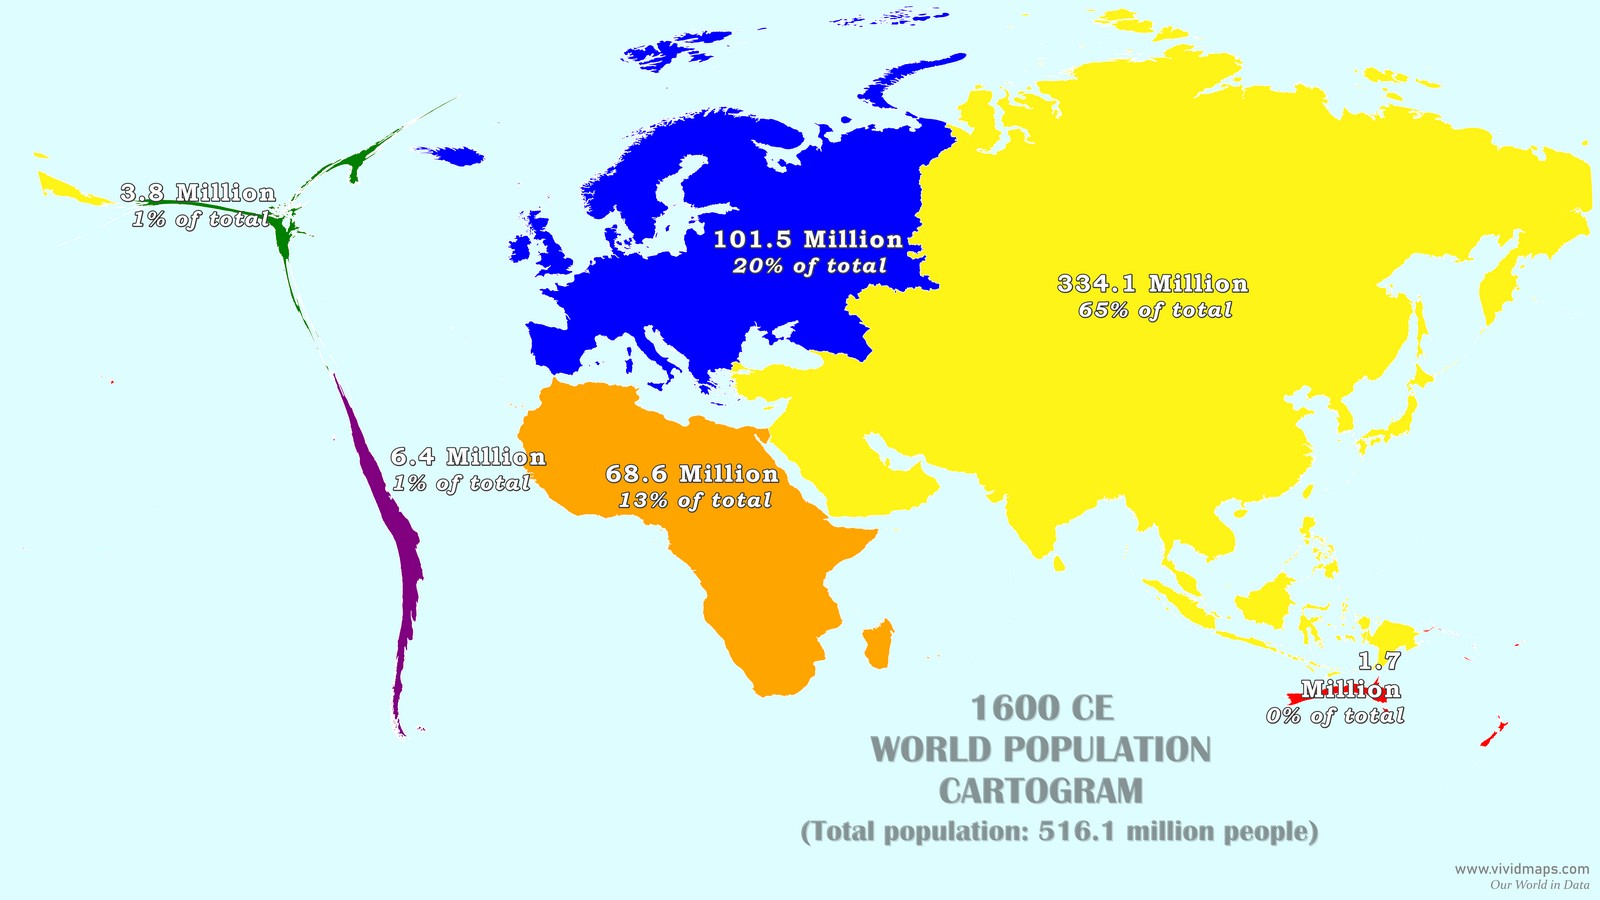
Tenochtitlan, the Aztec capital, held between 200,000 and 300,000 people in 1500. No European city was that size. The Inca road network covered more than 40,000 kilometres. North America held 30.5 million people and South America 29.9 million. By 1600, North America was down to 3.8 million.
South America to 6.4 million. About 50 million people were gone in one century.
The primary mechanism was not conquest, though warfare was real. It was disease. Smallpox spread through populations with no prior immunity, often traveling indigenous trade networks before any colonizer arrived in person. Some communities were already devastated before they ever encountered a European.
Over that same century, the world’s total population edged up from 503 million to 516 million. Europe, Asia, and Africa more than covered the loss.
| Continent | 1500 CE | Share | 1600 CE | Share | Change |
|---|---|---|---|---|---|
| North America | 30.5M | 6% | 3.8M | 1% | −87.5% |
| South America | 29.9M | 6% | 6.4M | 1% | −78.6% |
| Europe | 78.6M | 16% | 101.5M | 20% | +29.1% |
| Africa | 58.5M | 12% | 68.6M | 13% | +17.3% |
| Asia | 303.9M | 60% | 334.1M | 65% | +9.9% |
| Oceania | 1.6M | 0% | 1.7M | 0% | +6.3% |
| World | 503.0M | 516.1M | +2.6% |
In 1500, the Americas held nearly one tenth of all humanity. In 1600, they held less than 1% of a larger world.
The Industrial Revolution (Late 1700s–1800)
In 1700, there were 595.5 million people on Earth. In 1800, there were 983.1 million. A 65% increase in one century — which doesn’t fully register until you consider that it had taken from the first Homo sapiens until approximately 1700 CE to reach 595 million. The following hundred years added 388 million more.

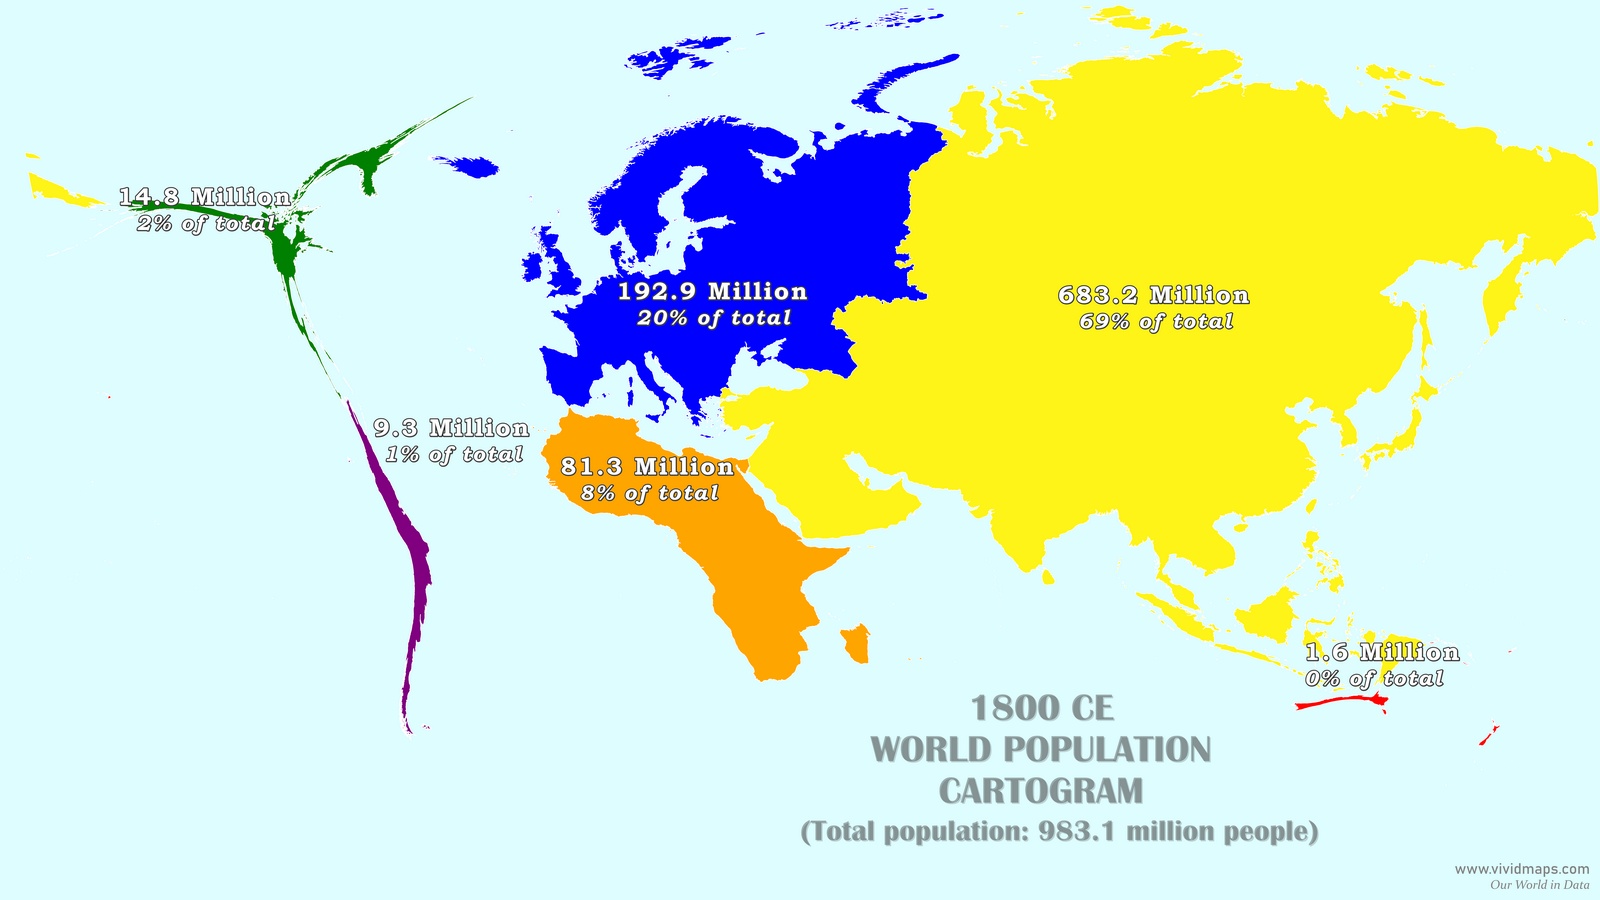
Improved agriculture, better food supply, and early gains in sanitation all played a role, though the gains were very unevenly distributed. Europe grew from 115.4 million to 192.9 million (67%). Asia from 386.9 million to 683.2 million (77%). North America grew from 6.8 million to 14.8 million, almost entirely through European immigration. Indigenous populations remained severely diminished and contributed little to that number. Africa added only about 2.7 million people across the whole century, going from 78.6 million to 81.3 million, even while the transatlantic slave trade was forcibly removing tens of millions from the continent.
| Continent | 1700 CE | Share | 1800 CE | Share | Change |
|---|---|---|---|---|---|
| North America | 6.8M | 1% | 14.8M | 2% | +117.6% |
| South America | 5.9M | 1% | 9.3M | 1% | +57.6% |
| Europe | 115.4M | 19% | 192.9M | 20% | +67.2% |
| Africa | 78.6M | 13% | 81.3M | 8% | +3.4% |
| Asia | 386.9M | 65% | 683.2M | 69% | +76.6% |
| Oceania | 1.9M | 0% | 1.6M | 0% | −15.8% |
| World | 595.5M | 983.1M | +65.1% |
The 1800 cartogram is the first in this series that looks anything like the world we know. Asia dominates, Europe is substantial, the Americas are beginning to refill. The billion mark arrived a few decades later. Each subsequent billion came faster than the one before it, and the intervals have kept compressing.
The Map Today
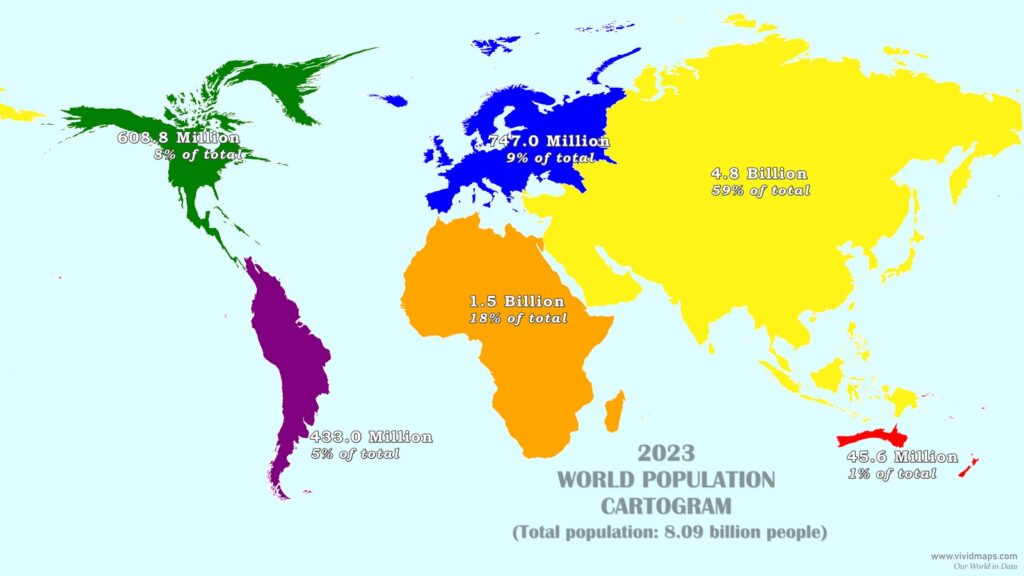
Asia has 4.8 billion people today, 59% of humanity. Africa 1.5 billion (18%), Europe 747 million (9%), North America 608.8 million (8%), South America 433 million (5%), Oceania 45.6 million (1%).
North America’s trajectory across these maps is the most dramatic of all. In 1600, the continent held fewer than 4 million people. It now holds 608 million, rebuilt through immigration. Indigenous populations never came close to recovering their pre-1492 numbers. Most of Africa’s growth happened after 1950. Asia’s share has been declining gradually as birth rates fall — particularly in East and South Asia.
Continental Peak Shares: Who Held the Highest Proportion of Humanity, and When
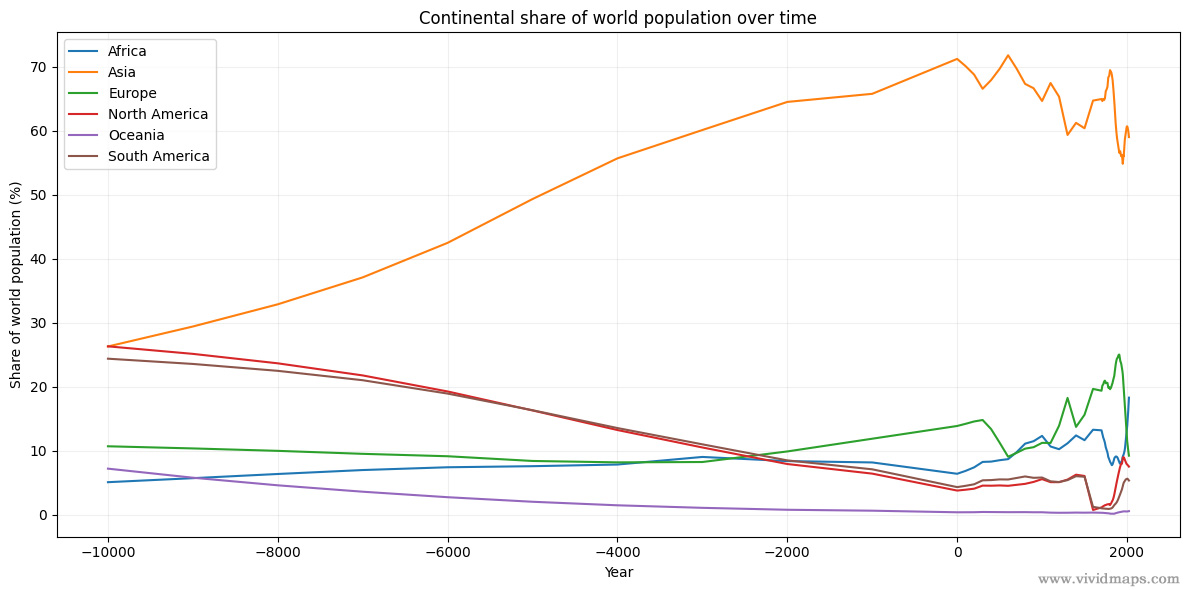
Asia’s all-time peak of 71.8% came in 600 CE, directly after the Plague of Justinian had gutted the Mediterranean world while leaving much of rural Asia intact. Europe peaked in 1908, after industrialization and colonial-era demographics had placed roughly a quarter of all humanity within European-origin populations. That share has declined in every decade since.
| Continent / Region | Year | Peak Share | Population at Peak |
|---|---|---|---|
| North America | 10,000 BCE | 26.3% | ~1.18 million |
| South America | 10,000 BCE | 24.4% | ~1.10 million |
| Oceania | 10,000 BCE | 7.2% | ~324,000 |
| Asia | 600 CE | 71.8% | ~195.1 million |
| Europe | 1908 | 25.0% | ~435.5 million |
| Africa | 2023 | 18.3% | ~1.48 billion |
Africa at 18.3% in 2023 has never been higher in the dataset. It is the only major region where the peak is almost certainly still ahead.
The Population Peak
The UN currently puts the likely global peak somewhere around 10.3 billion, expected to arrive in the mid-2080s. In a growing number of countries, birth rates have already fallen below replacement level. At some point after the peak, the global total may start drifting downward as populations in parts of Europe and East Asia begin to shrink outright.
Africa is the only major region growing fast enough to shift the cartogram substantially in the coming decades. Asia’s share is already edging down. Europe’s absolute population is projected to shrink within decades. The 2100 map will almost certainly show an Africa larger than at any point in the 12,000 years covered here.


