Major forest types of the United States (1967)
Compiled from information furnished by the United States Forest Service. Related post: – U.S. Vegetation Map (1970)
Read MoreMaps depicting environmental degradation across planet.
Compiled from information furnished by the United States Forest Service. Related post: – U.S. Vegetation Map (1970)
Read MoreA biome is a community of plants and animals living together in a particular climate. There are 14 terrestrial biomes. Seven are forested, and 7 are not forested.
Read MoreThe map is part of a broader effort to establish a hazards monitoring system that combines satellite observations of rainfall
Read More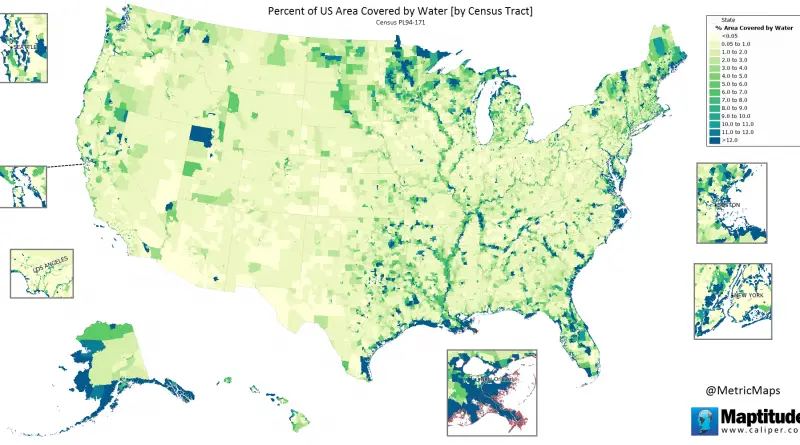
Source: https://metricmaps.org/2017/04/21/us-area-covered-by-water/
Read MoreLead exposure varies in neighborhoods across the most populous U.S. county. In at least 323 census tracts, more than 5
Read MoreThe comparative illumination of the night sky between 2012 and 2016. Areas of new nighttime light are shown in blue
Read MoreA difference masking between NASA’s Earth at night 2012 imagery and 2016 imagery to isolate areas of new light within
Read MoreChris Brackley via canadiangeographic.ca Cumulative stress is the weighted sum of 34 environmental stressors. Environmental stressor groups: – Toxic point
Read MoreRelated posts: – 6 maps that show the anatomy of America’s infrastructure – Distance from crude oil pipelines by Zip
Read Morebusinessinsider.com Biggest natural decreases (Net deaths birth per 1,000 residents): 1. Ontonagon, Michigan – 13.6 2. Emporia city, Virgina –
Read More