Interactive maps
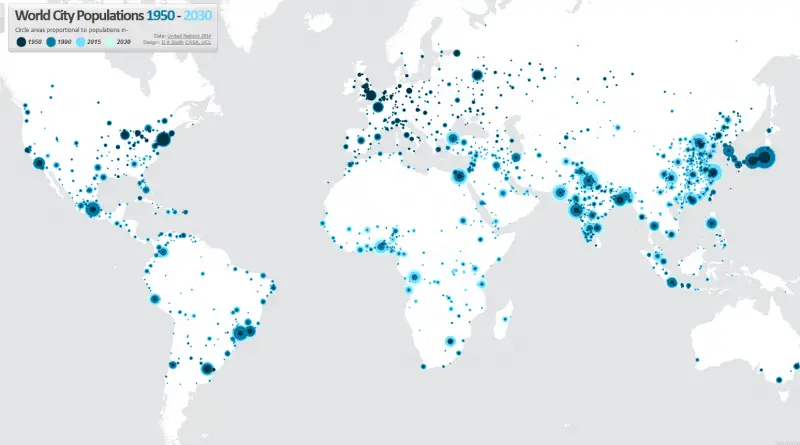
World city populations (1950 – 2030)
This map visualizes the radical transformation that has occurred across the globe in the last 60 years, from a 30%
Read MoreSouth Africa’s racial dot map
Via adrianfrith.com Related posts: – USA: The racial dot map – UK ethnicity map (one dot per person) – Australia:
Read MoreMap where Muslims (mostly) don’t live
This map shows where Muslims made up less than 1% of the population. Countries with larger Muslim populations are shown
Read MoreGun sales in the U.S.
The map shows licensed importers, pawnshops and sellers of firearms per 100,000 residents and at individual locations nationally. Via oregonlive.com
Read MoreHow many people have been shot near you this year?
Every day, 30 Americans die in gun homicides. Another 200 are injured by bullets. These incidents of gun violence are
Read More20 thousand tons of TNT
These secret maps were used to explain to the members of the Congressional Joint Committee on Atomic Energy (JCAE) the
Read MoreMapping climate change in South Africa
This map shows how much average temperatures have changed and are likely to change by in future. Scroll through the
Read More