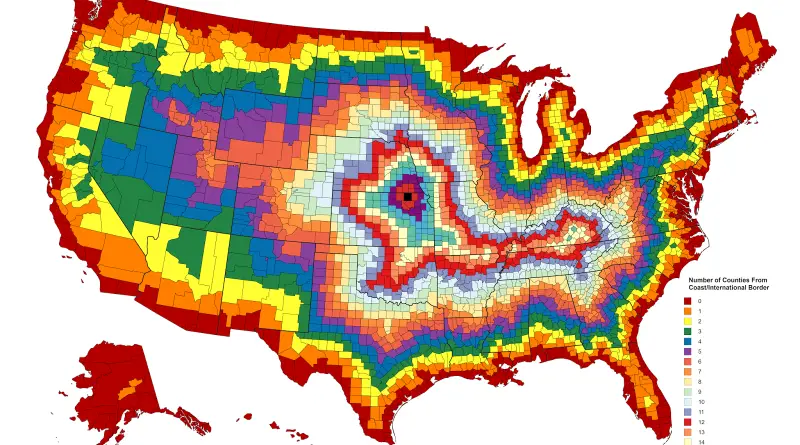
Mapping ineligible voters
Via fakeisthenewreal.org
Read MoreVia fakeisthenewreal.org
Read More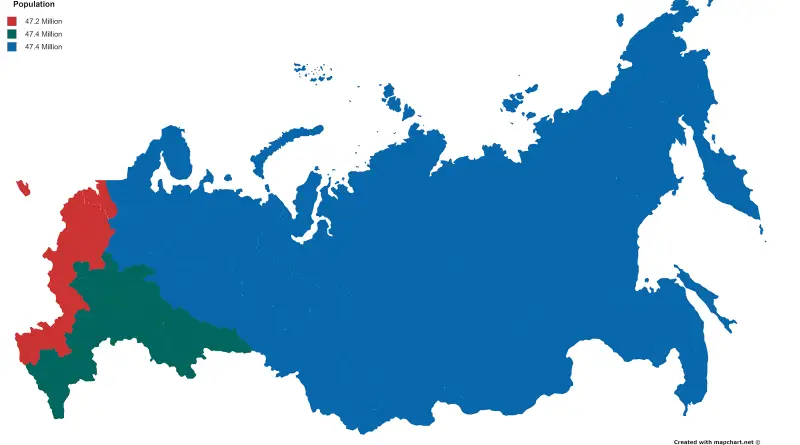
Half of Russia’s 144mln population lives in the red part.
Read More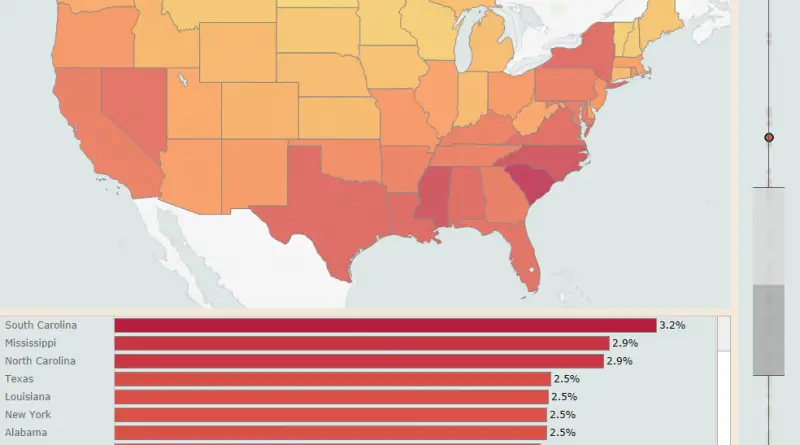
Related post: – United States Old Maps
Read More
Related posts: – White Non-Hispanic population percentage by county – Obesity prevalence in the United States
Read MoreHaving begun its life as a small collection of Holy Roman vassals in the late 13th Century, Switzerland consolidated its
Read More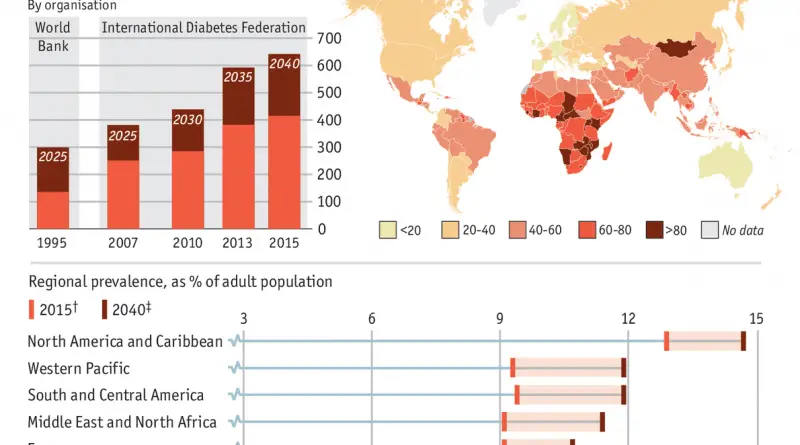
Via economist.com Related post: – Diabetes prevalence in the U.S.
Read More