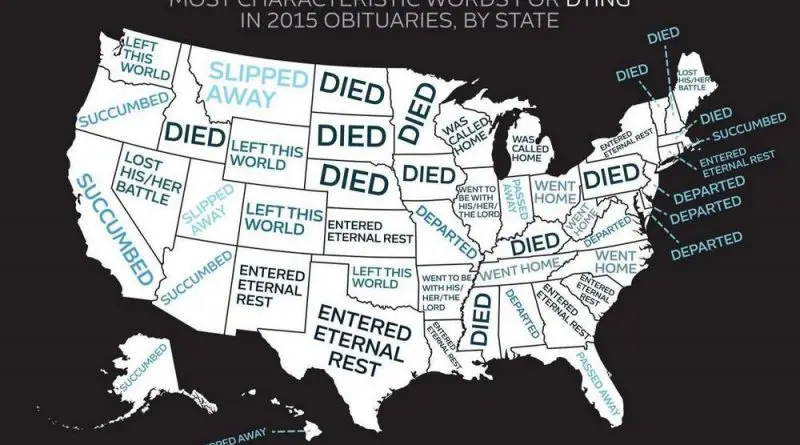
Farewell Phrases: How Americans Describe Death in Obituaries
From “slipped away” to “entered eternal rest,” the language of loss varies dramatically across the United States, offering a unique glimpse into regional communication styles.
Read MoreMaps of the US
From “slipped away” to “entered eternal rest,” the language of loss varies dramatically across the United States, offering a unique glimpse into regional communication styles.
Read More
In 1910, Manhattan crammed 2.3 million residents into 22 square miles—a density the borough has never matched since. By 2025, the overnight population sits around 1.7 million. But Manhattan’s real story isn’t about who lives here anymore. Every weekday, the island swells to nearly 4 million people by early afternoon, then empties out again each night. Midtown hits densities comparable to Mumbai and Macau at peak hours, while neighborhoods north of Central Park lose residents during work hours. Maybe the question isn’t how many people live in Manhattan—it’s how many people Manhattan holds at any given moment.
Read More
Uncover the hidden diversity of palm trees native to the United States, from Florida’s lush landscapes to the unique ecosystems that support these remarkable plants.
Read More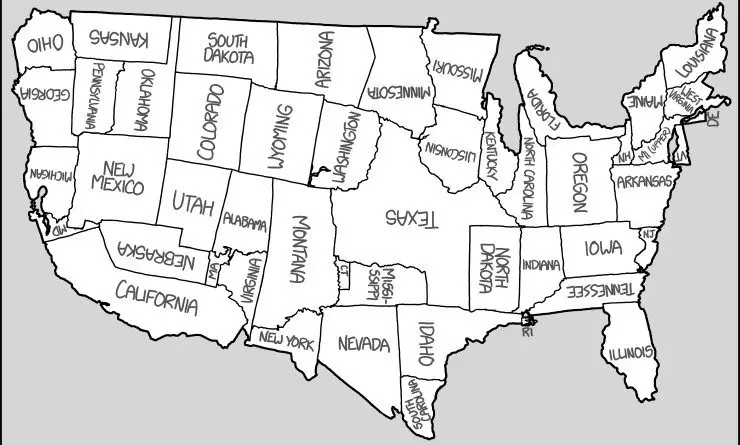
xkcd’s comic takes the United States map to a whole new level by relocating states to surprising places. It’s geography with a twist, plus links to U.S. map posters!
Read More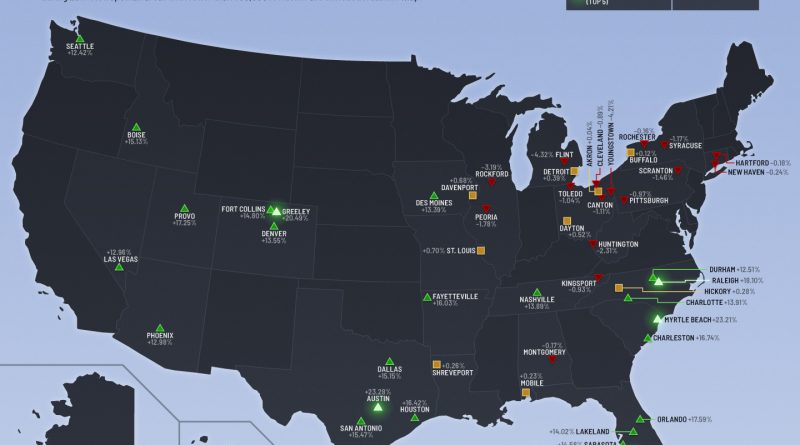
Dive into the shifting demographics of the United States with this post on the fastest- and slowest-growing metropolitan areas since 2010.
Read More
Climate change is projected to have vastly different economic impacts across U.S. states and counties, with coastal regions facing the heaviest financial burden. Florida and Texas each face potential GDP losses exceeding $100 billion, while states like Vermont and New Hampshire show minimal projected impacts. The analysis reveals that lower-income counties often bear a disproportionate burden of climate-related economic damage, highlighting the need for equitable adaptation policies.
Read More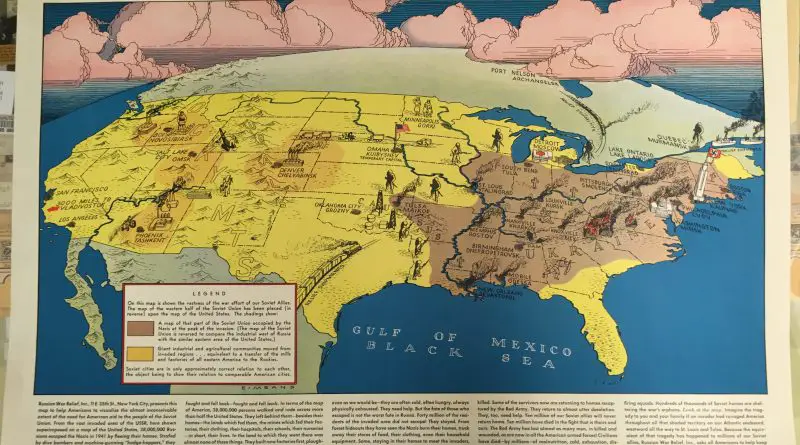
Operation Barbarossa was the invasion of the USSR by Nazi Germany and many of its Axis allies, starting on Sunday, 22 June 1941, during World War II. The military operation, codenamed after Frederick Barbarossa (“red beard”), a 12th-century Holy Roman emperor and German king, put into activity Nazi Germany’s ideological goal of occupying the western USSR to repopulate it with Germans.
Read More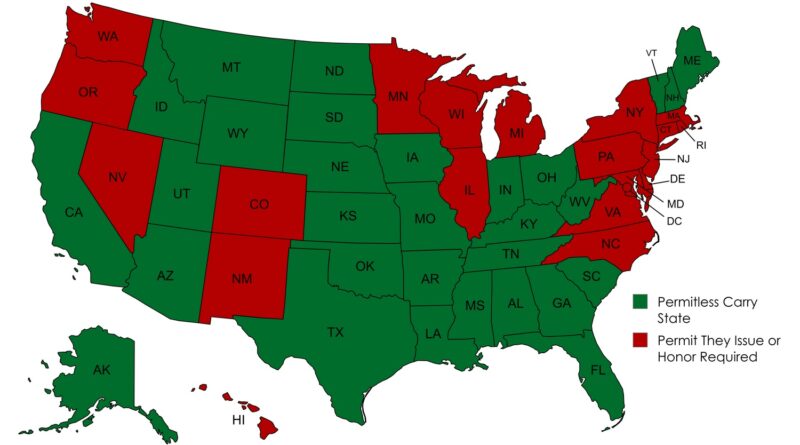
In 2025, 29 states now allow permitless or “constitutional” carry — a major shift in U.S. gun laws over the past two decades. The updated map shows where these laws apply, how states differ on open vs. concealed carry.
Read More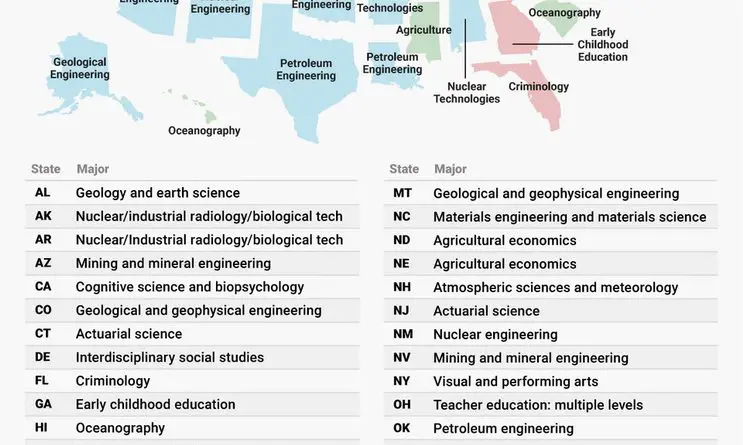
Ever wondered why certain college majors are surprisingly popular in different states? Let’s look at how local industries and opportunities create unique educational patterns across America.
Read More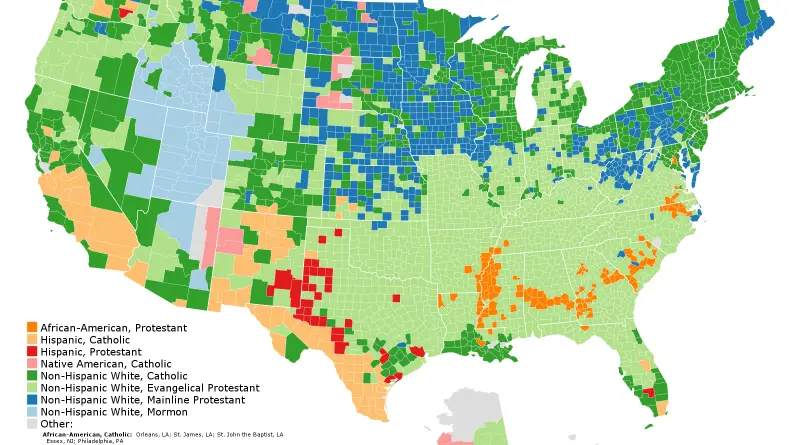
Discover the stories behind America’s diversity with a map showcasing the largest ethnic and religious groups in each U.S. county. From Hispanic Catholics in the Southwest to Evangelical Protestants in the South, this map reveals the historical and cultural forces shaping the nation.
Read More