When Los Angeles Becomes a Bay
Jeffrey Linn mapped what Southern California looks like when 80 meters (260 ft) of seawater flood the LA Basin. Two versions show the transformation from basin to bay.
Read MoreMaps of the US
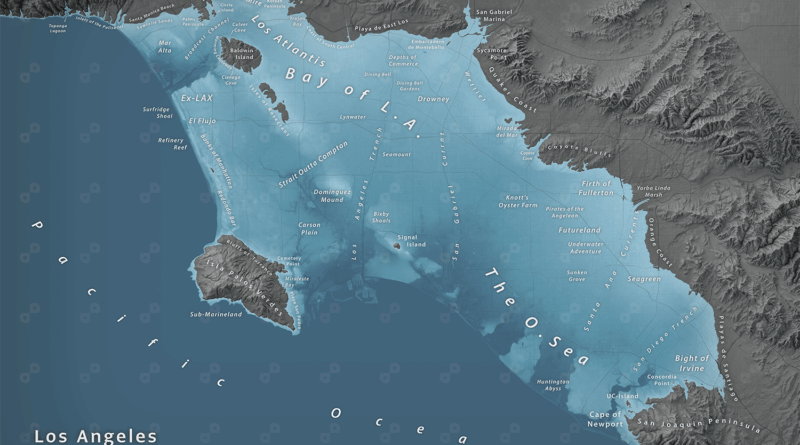
Jeffrey Linn mapped what Southern California looks like when 80 meters (260 ft) of seawater flood the LA Basin. Two versions show the transformation from basin to bay.
Read More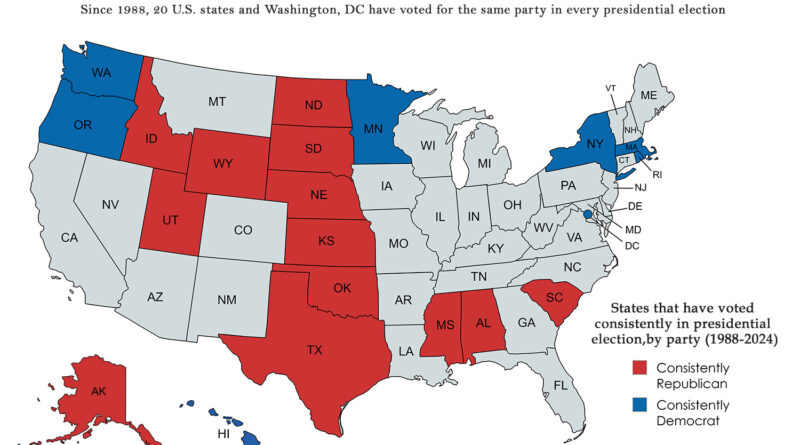
While swing states dominate election coverage, there’s another electoral geography worth examining. Twenty states and Washington, DC have remained remarkably consistent in their presidential voting patterns since 1988, creating a stable foundation beneath the shifting political landscape. Which states have never wavered, and what does their geographical distribution tell us about American political geography?
Read More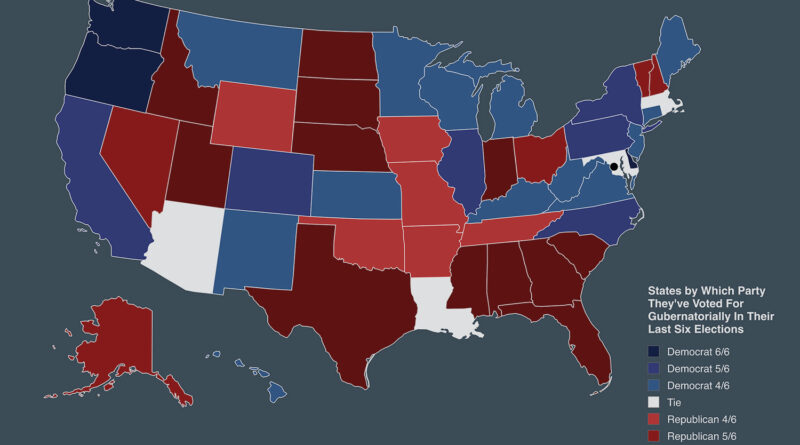
US states with Democratic or Republican governor wins over last six elections: Washington all six Democratic, Texas all six Republican, Arizona even three each, plus regional trends and surprises like Kansas four Democratic.
Read More
Pull up Google Trends for holiday pie searches and you’ll see something unexpected: America’s pie map looks different than it did five years ago. The South’s pecan pie territory shrank dramatically. New England’s letting go of apple pie. And pumpkin? It’s taking over almost everywhere. What happened to our regional baking traditions?
Read More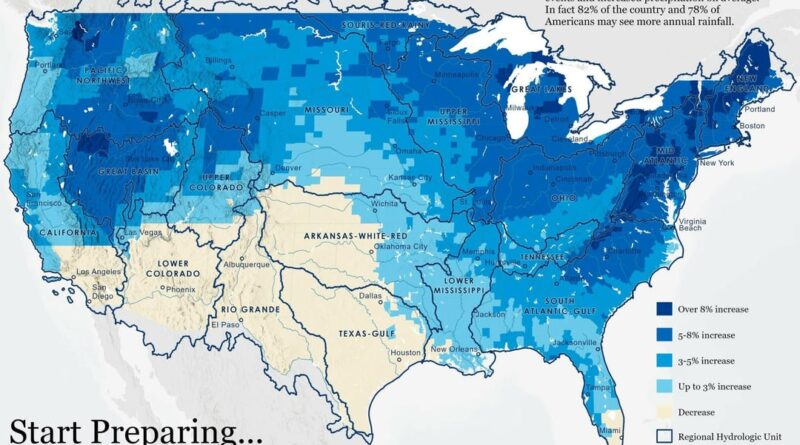
Two climate projection maps show exactly where America’s rainfall patterns will change by mid-century. Most regions will get wetter, but some will get drier, and certain areas face storms that dump enormous amounts of water in dangerously short periods.
Read More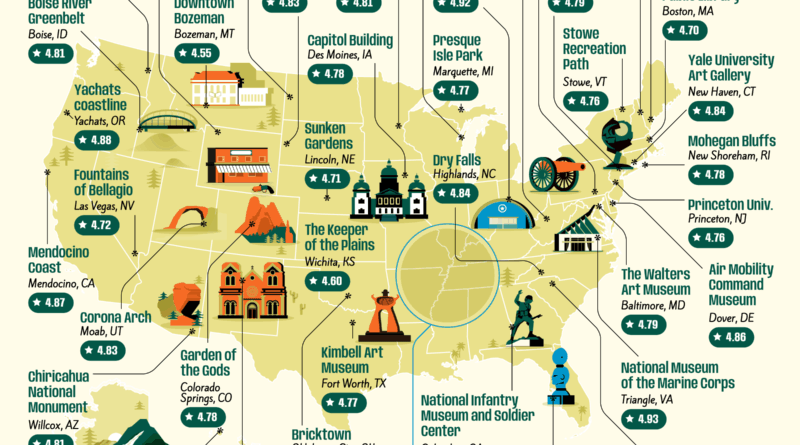
A glass art gallery in Florida. A bicycle museum in Pittsburgh. Coastal cliffs in Maine. These are the free attractions that earned the highest ratings from travelers in each state.
Read More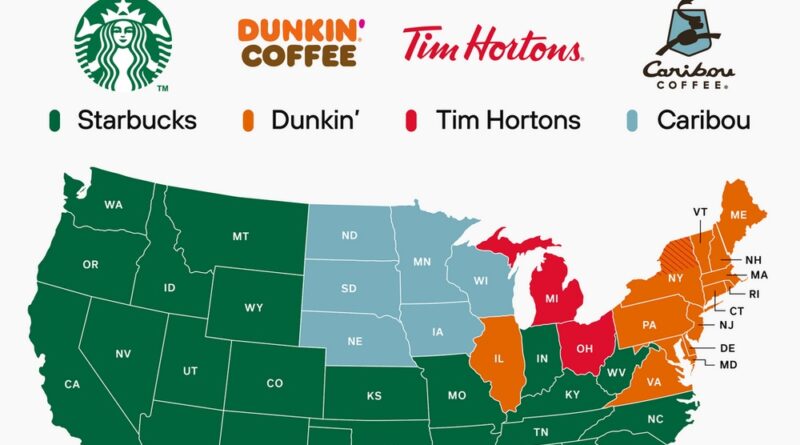
Starbucks leads in most American states, while Dunkin’ commands IL, VA, and the Northeast. Tim Hortons dominates MI and OH, and Caribou leads six Upper Midwest states.
Read More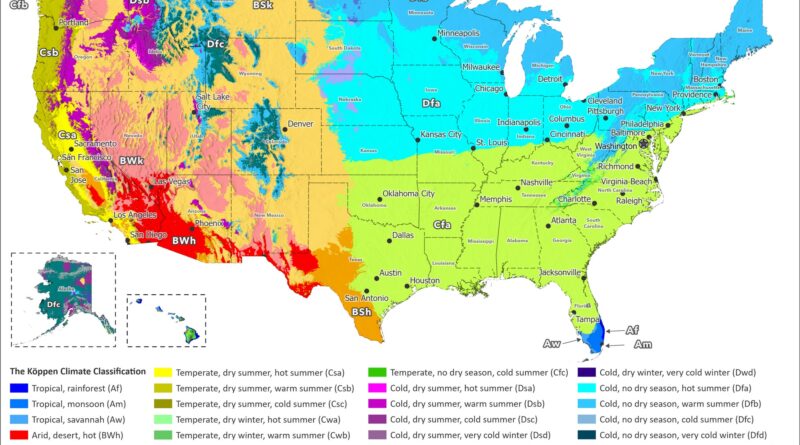
New Köppen-Geiger climate maps of the United States reveal dramatic shifts from 1901-1930 to 2077-2099. Watch animated comparisons showing how tundra retreats in Alaska, continental zones move north, and arid regions expand in the West under the ssp2-4.5 climate scenario.
Read More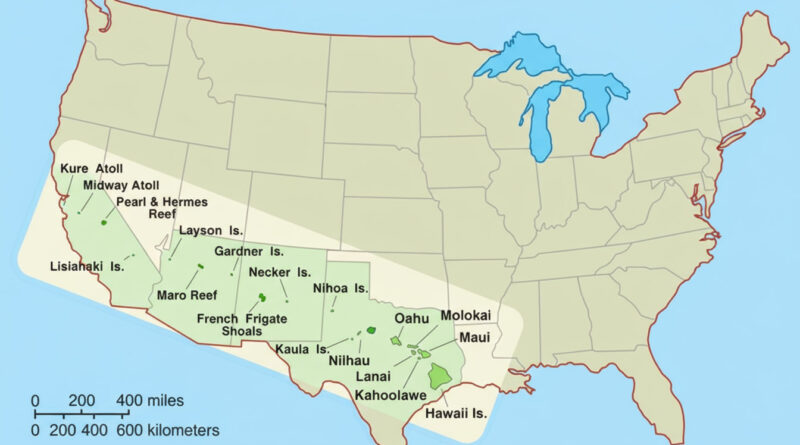
The Hawaiian archipelago stretches 2,450 km (1,520 mi) across the Pacific, encompassing 137 named islands from the Big Island to remote Kure Atoll. That’s roughly the distance from New York to Denver, yet often compressed on standard maps.
Read More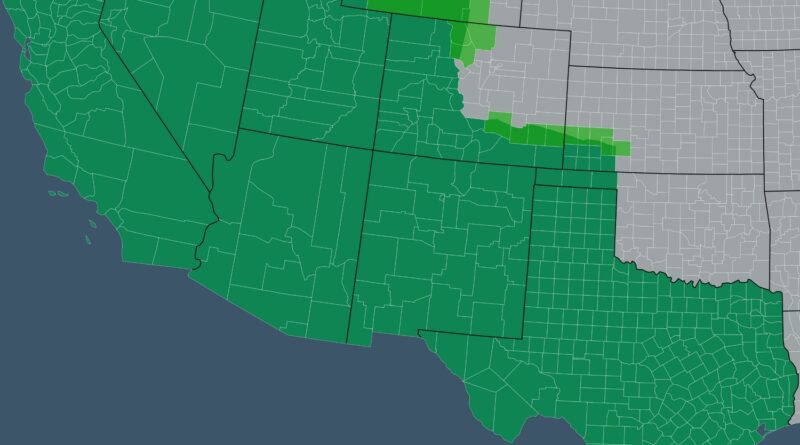
Most people know California and Texas used to be Mexico. But did you know half of Colorado was too? Nevada, Arizona, New Mexico, and Utah were completely Mexican. Even bits of Wyoming, Kansas, and Oklahoma. This map shows all 447 counties that became American in the 1840s and 1850s.
Read More