Change in margin between 2004 & 2016 elections
Related posts: – The power of small U.S. states – 3D map of county-level election results – Geographically approximate, population-normalized
Read MoreRelated posts: – The power of small U.S. states – 3D map of county-level election results – Geographically approximate, population-normalized
Read MoreRelated posts: – Mapping Displacement and Gentrification in the San Francisco Bay Area – America’s great housing divide: Are you
Read More
In 1990, about 8.8 million infants younger than one year died worldwide. In 2015, this number almost halved to 4.6 million infant deaths.
Read More
The Polity IV score classifies the type of political regime for each country on a range from -10 (full autocracy)
Read More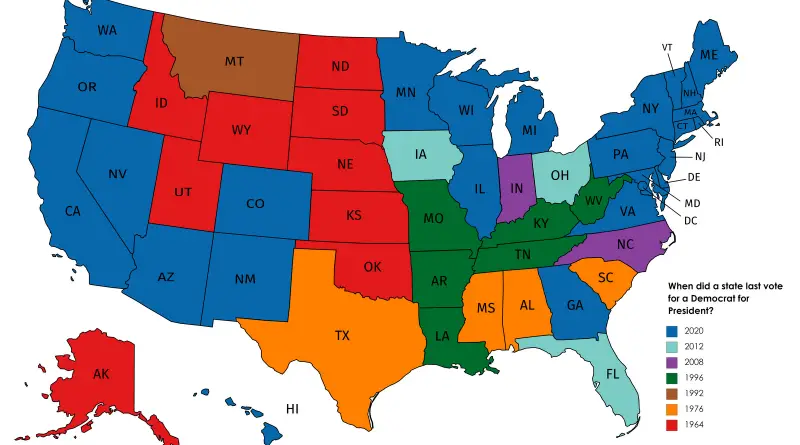
There have been 46 presidencies (including the contemporary one, Joe Biden, whose term began in 2021), and 45 different people have worked as president. Grover Cleveland was selected to 2 nonconsecutive terms, and as such, is regarded the 22nd and 24th president of the U.S.
While some U.S. states consistently have Democrat or Republican victories, other swings between the two parties. Here the U.S. presidential voting history science in 1789.
Read More
Via flowingdata.com Related posts: – Prevalence of self-reported obesity among non-hispanic white adults by U.S. state (2012 – 2014) –
Read MoreSince 1901, the average temperature across the contiguous U.S. states has grown at an average rate of 0.16°F (0.09°С) per decade. Average temperatures have grown more rapidly since the late 1970s (0.31 to 0.54°F or 0.17°С to 0.3°С per decade since 1979). Eight of the top ten hottest years on record for the contiguous U.S. states have happened since 1998, and 2012 and 2016 were the 2 warmest years on record. Over the following few decades (2021–2050), yearly average temperatures are supposed to grow by around 2.5°F (1.39°С) for the U.S., related to the recent past (average from 1976 – 2005), under all probable future climate scenarios.
Read MoreColor represents people per square mile. Line fills represent U.S. territories with no data yet.
Read More
New York City generated over 3 million tons of household waste in 2015. This map follows its journey from the
Read MoreUnemployment in the United States from 1990 thru July 2016.
Read More