As climate changes, southern states will suffer more than others
The researchers estimate that the nation could face damages worth 0.7 percent of gross domestic product per year by the
Read MoreThe researchers estimate that the nation could face damages worth 0.7 percent of gross domestic product per year by the
Read MoreThe bureau on Thursday published its latest detailed population estimates for each of the more than 3,000 American counties. Sioux
Read More
The global sea-level rise started around the beginning of the 20th century. From 1900 to 2016, the average sea level on the planet rose by 16–21 centimeters or 6.3–8.3 inches. According to the extreme scenario, an increase in sea level can be presumed as 189 centimeters (6.2 feet) by 2100.
Read More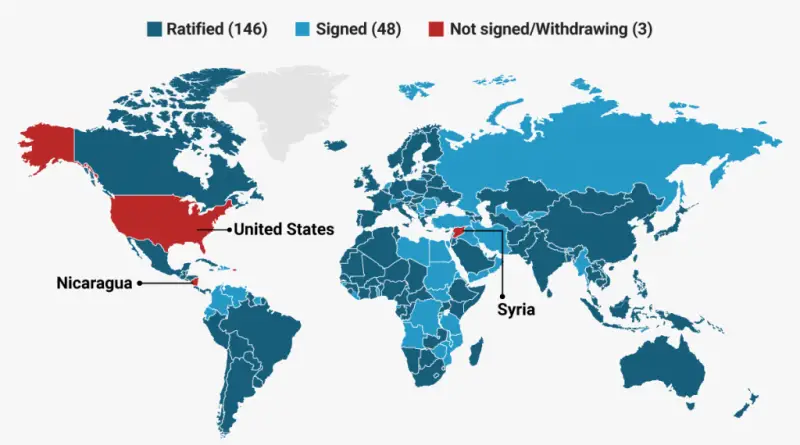
Business Insider Yele program on Climate Change Communication Total money signed to Paris agreement, USD Money per capita signed to
Read MoreThe ice age is a long period of decrease in our planet’s surface and atmosphere temperature, resulting in the growth of continental and polar ice sheets and mountain glaciers. During the last ice age about one-third of the Earth’s surface was covered by ice.
Read More
Delhi passed Kolkata to become the second most populous city in the country, as population growth slowed in the latter
Read More
Source: Wikipedia
Read More
Reddit user: Truelz
Read More2016 was the warmest year on record: +0.83 °C +/− 0.10 °C warmer than the average for the 1961–1990 reference
Read More