Real estate
30 people drew a map of the world from memory
30 people drew a map of the world from memory. The results were merged.
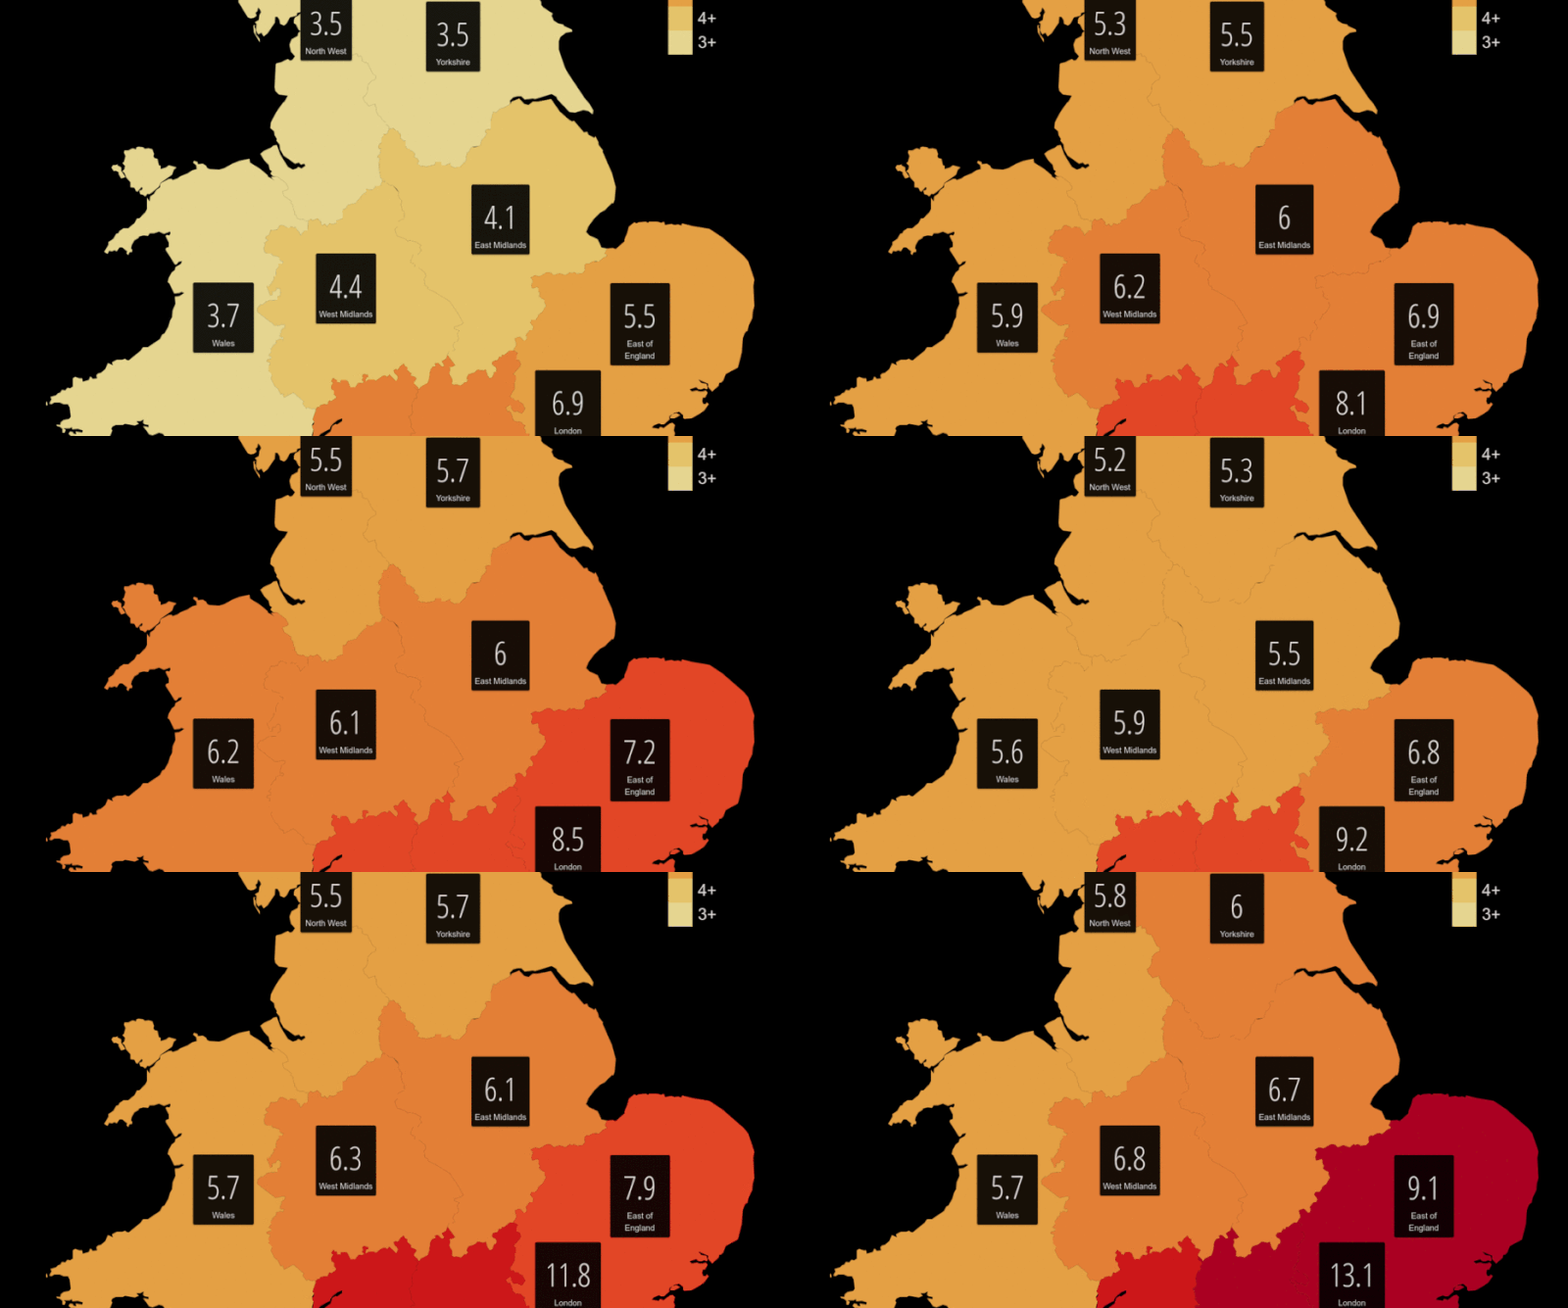
Read MoreEngland and Wales house prices
This is a flythrough of a 3D surface representing the average house prices in England & Wales. The video was
Read MoreIs it possible to afford rent working minimum wage?
How many hours of minimum wage work… Does it take to afford rent in each state? If you work 40
Read MoreIn A High-Rent World, Affordable And Safe Housing Is Hard To Come By
There are 10.4 million extremely low income households in the US and only 3.2 million affordable housing units. Here are
Read MoreThe cost of housing around the World
The mortgage and rent index of countries around the world. Mortgage index refers to the percentage one must spend of
Read More
