20 Best Maps of 2020
The most attractive maps of the last year ranked by views. From the largest predator in each U.S. state to tipping etiquette around the world, these marvelous maps show cartography at its best.
Read more: 20 Best Maps of 2020

The most attractive maps of the last year ranked by views. From the largest predator in each U.S. state to tipping etiquette around the world, these marvelous maps show cartography at its best.
Read more: 20 Best Maps of 2020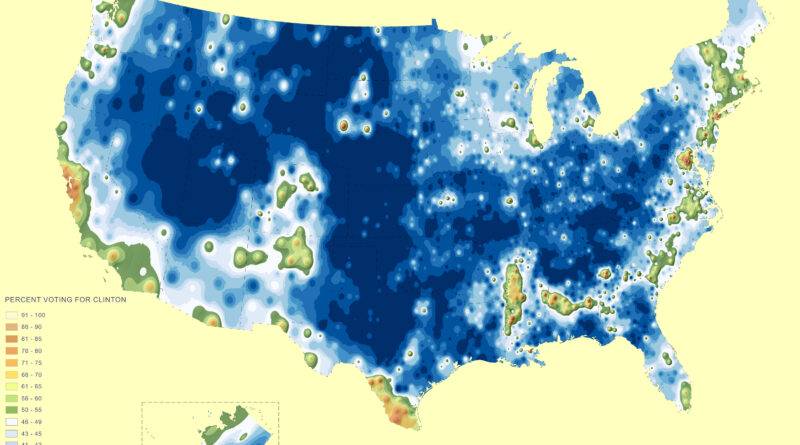
Biden won the 2020 popular vote by more than 7 million, yet most counties voted for Trump. These maps show the gap between land and people.
Read more: 2020 U.S. Election Mapped, TrumpLand vs Biden Archipelago
The Great Lakes are the most extensive freshwater system globally (94,600 sq mi / 244,000 sq km). The Lakes contain 5,400 cu mi (22,500 cu km) of surface freshwater on earth or 6 quadrillion gallons of freshwater (22.7 quadrillion liters), accounting for about 21% of the world’s surface freshwater or 84% of North America’s surface freshwater.
Using Digital Elevation Model data, I made the map of the Great Lakes in watercolor style.
Read more: Maps of the Great Lakes
Data analyst Alasdair Rae created unique 3D maps of the global population density. This idea inspired me to make three-dimensional maps depicting different climatic parameters. To create these maps, I used Worldclim data: average temperature (°C), precipitation (mm), solar radiation (kJ m-2 day-1), and wind speed (m s-1).
Read more: 3D Mapping of The Global Climate
Joe Bide has been elected the 46th president of the U.S., In 2020, he has enlarged Hilary Clinton’s record from 51 to 162 electoral votes, while Donald Trump has raised from 16 to 98 votes. But many Americans still didn’t vote. What if “I didn’t vote” ran as a U.S. presidential candidate in the 2020 election?
Read more: What if “Did Not Vote” were a candidate in the 2020 U.S. Presidential Election?
The U.S. population distribution is uneven. This uneven distribution of the population is due to historical and geophysical factors (climate, landforms, soil conditions). Approximately 40% of the U.S. population lived in counties on the shore. Nowadays, population decline hit most nonmetro U.S. counties in the Great Plains. Speedy population increases in nonmetro counties nearest to large-sized metro areas and recreation regions with beautiful landscapes.
Read more: The U.S. Archipelago
A forest is an area of land covered by trees. According to the Food and Agriculture Organization, forests cover some 3.9 billion hectares (or 9.6 billion acres), which is about 30% of the Earth’s land surface.
Read more: The World’s Forests Mapped
Happiness connects with many life factors: GDP per capita, social support, healthy life expectancy, freedom to make life choices, generosity, and the absence of corruption. Which country is the happiest?
Read more: The happiest countries in the world (2013 – 2020)
The maps of the United States show elevation, precipitation, and population density in the style of Joy Division.
Read more: The atlas of the United States in the style of Joy Division
The Asian population in the United States grew to almost 12 million by 2000 and approximately doubled to 22.5 million by 2019 (7% of the U.S. population). The Asian population in America is predicted to touch 46 million by 2060, outdoing Hispanics in 2055.
Read more: Absence of Asians
Hispanic are Americans who are the posterity of immigrants from Spain or Latin America. Hispanics generally are the leading minority ethnic group in the U.S., after non-Hispanic white Americans. According to U.S. Census Bureau data, in 2020, Hispanics made up 18.7% (62.1 million) of the U.S. population.
Read more: Absence of Hispanic
Now that 2019 is almost done, we think it would be interesting to look backward at our most favored maps of the year.
Read more: 20 Best Maps of 2019
Black Americans compose the 2nd-largest racial group in the United States, after White Americans and Hispanic Americans. African Americans make up 14.6% (47.8 million) of the U.S. population. In recent decades, there has been an increase in U.S. counties with a predominance of blacks.
Read more: US African American Population by County