Exploring the Rivers of Europe: A Journey Through Nature’s Lifelines
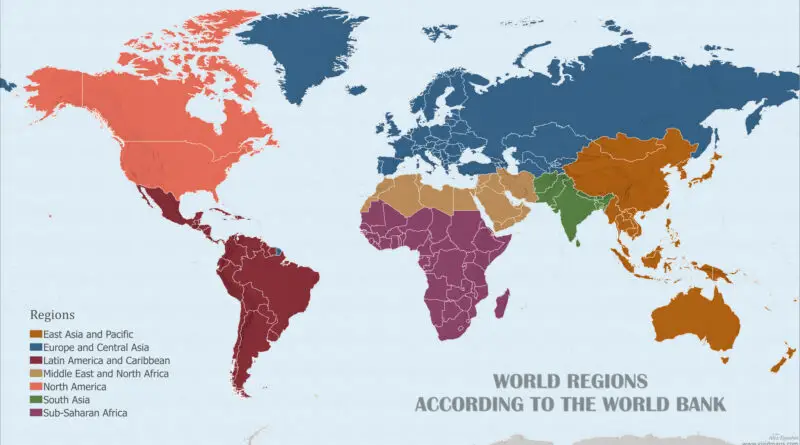
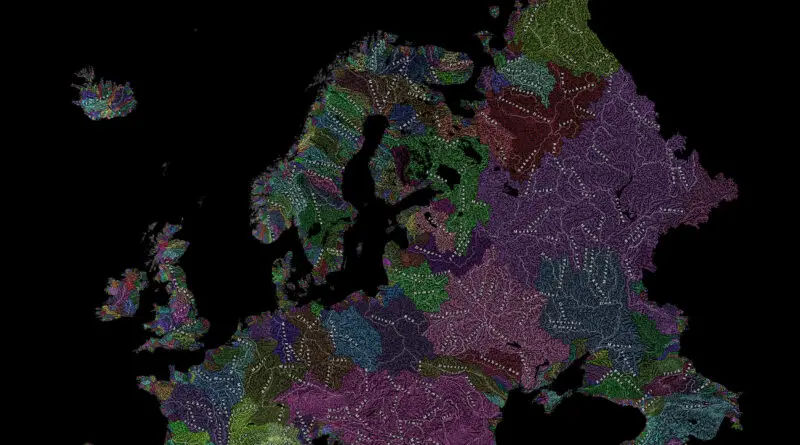
Rivers are the lifelines of our planet, shaping landscapes, supporting ecosystems, and providing vital resources to communities. In Europe, the continent’s rivers have played a crucial role in its history, culture, and economy. Join us on a journey as we explore the rivers of Europe, from the mightiest to the most intricate.
Read More