Skip to content
Vivid Maps Logo

  • Atlases
  • Map Posters
  • Scratch Maps
  • Globes
  • Videos
CartogramsInfographics
November 7, 2016 Alex

November 5, latest sunrise of the year

November 5th is the latest sunrise of the year (due to DST) south of 49.5° latitude. Via Brian

Read More
CitiesInfographicsTransport
November 7, 2016 Alex

Comparing Metropolitan Form, Density & Transit Systems

Although many argue that cities around the world are moving towards automobile-dominant, low-density sprawl, a comparison of the Toronto region

Read More
ForecastsTransport
November 7, 2016 Alex

Future South East Asia: Current & proposal railways in South East Asua

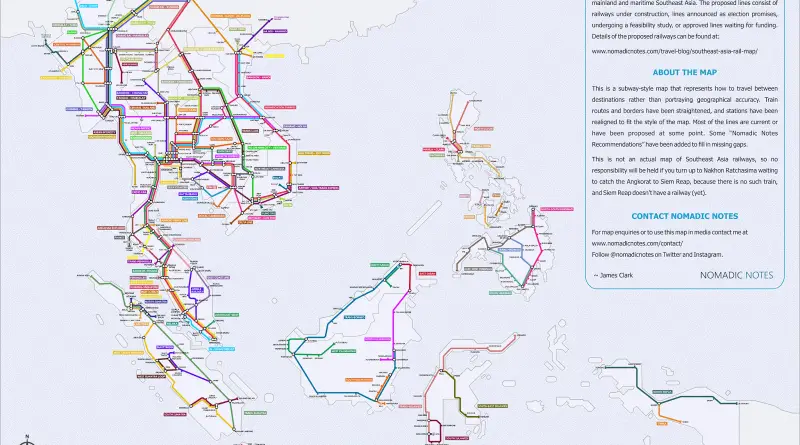
This map is a combination of current and proposed railways across the mainland and maritime Southeast Asia. The proposed lines

Read More
The world split into 7 equal areas of population
DemographyPopulation
November 7, 2016 Alex

Continents and countries split into areas of equal population

The world population has reached 8 billion people as of November 2022 and is still growing. Population size varies at differing rates in different regions. The maps below show different ways of dividing the Earth, continents, and countries into areas of equal population.

Read More
Sport
November 7, 2016 Alex

Ways to split the US into areas

The U.S. split into the areas dominated by fans of each NFL team The U.S. split into the areas dominated

Read More
EducationMapping StereotypesReal estateWorld
November 6, 2016 Alex

The World University Rankings 2016 – 2017

The Times Higher Education World University Rankings 2016-2017 list the 980 top universities in the world, making it our biggest

Read More
Mapping StereotypesPopulationVivid maps
November 6, 2016 Alex

Russian population split into 3 equal areas

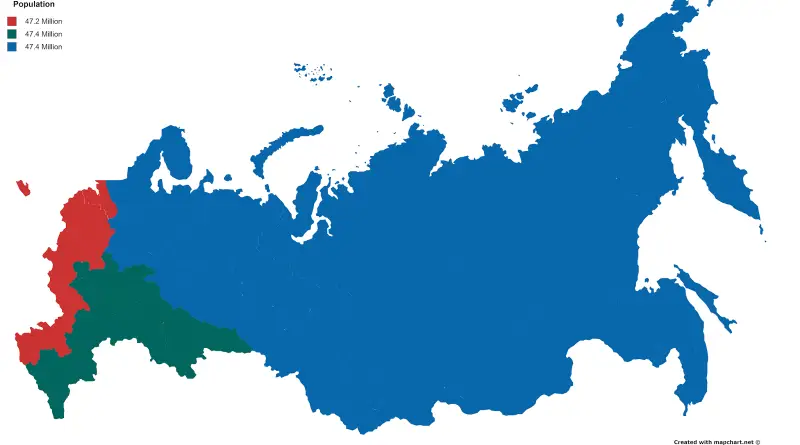
Related post: – China’s population split in half

Read More
U.S. Biggest cities
CitiesPopulation
November 6, 2016 Alex

Percentage of U.S. state population living in state capital metropolitan area and its Most Populous City

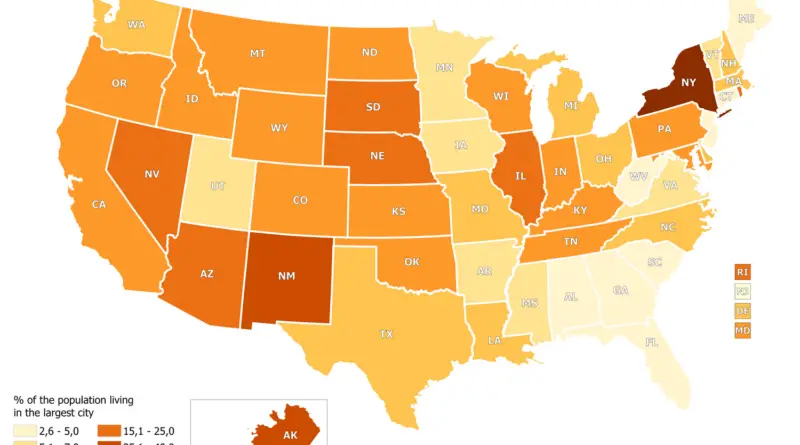
In most U.S. states, less than 20 percent of the population lives in the largest city. In South Carolina and West Virginia, even less than 3% of the population lives in the largest city. The highest percentage of the state’s population lives in New York City (New York) – 41.30% and Anchorage (Alaska) – 39.52%.

Read More
Environment mapsInteractive mapsMapping Stereotypes
November 5, 2016 Alex

NYC Street Tree Map

The New York City Street Tree Map brings New York City’s urban forest to your fingertips. For the first time,

Read More
Languages
November 5, 2016 Alex

Most common letters which start placenames in the UK

Used most common letter (or letters) which are at the start of placenames. Binned into grid squares of 40km x

Read More
Page 281 of 679« First«...102030...279280281282283...290300310...»Last »

Trending now

  • Decolonisation of Africa mapped
    Atlas of the colonization and decolonization of Africa
  • Human phenotypes in Europe
    Human Phenotypes Mapped

Related Products

Push pin maps · Globe drinks cabinets · Maps of the United States · Board games · Monopoly · Map-based strategy board games · History Board Games · Coloring Books · Handheld GPS · GPS Watches · GPS Trackers

Vivid Maps Tools

· Convert Latitude/Longitude
· Elevation Finder
· Distance Calculator
· Kilometers to Miles Converter
· Kilograms to Pounds Converter
· Liters to Gallons Converter
· Temperature Converter
· Antipodes Map
· Find cities with a similar climate
· Find cities with a similar climate (2050)
· How hot cities could be in 2050
· The U.S. Population Lines

About
Privacy Policy

Copyright © 2026 Vivid Maps. All rights reserved.