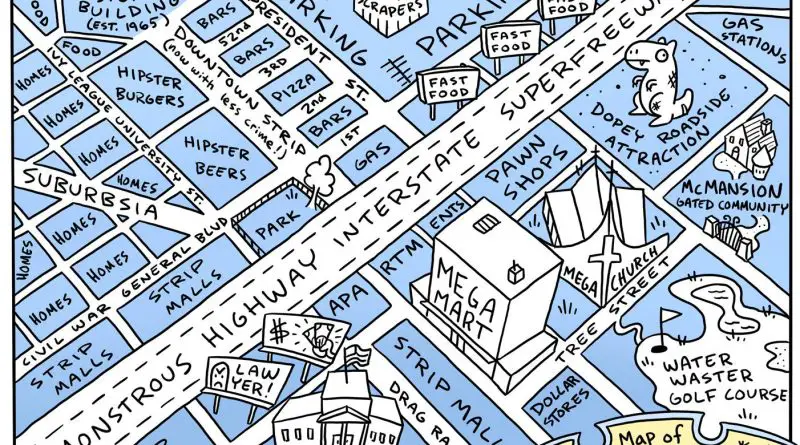
U.S. Non-Hispanic White Population by County (1990 – 2017)
In 2011, for the first time in United States history, non-Hispanic whites accounted for under half of the births in
Read MoreMaps of the US
In 2011, for the first time in United States history, non-Hispanic whites accounted for under half of the births in
Read MoreExplore the incredible diversity of California’s landscapes through the lens of the Paramount Studio map of 1927. Learn how this state can replicate regions like the French Alps, Siberia, the Sahara Desert, and more, making it a favorite for filmmakers around the world.
Read MoreLife expectancy is determined as the average number of years that a person could expect to live if they experienced the age-specific mortality rates prevailing in a given nation in a select year. In 1930, life expectancy at birth in the United States was 58 for men and 62 for women. By 2001, the average U.S. life expectancy was 74 for men and 80 for women. In 2018 the average life expectancy was 80 years for males and 84 years for females.
Read MoreOne thousand five hundred forty-three men and women have been executed in the U.S. since the 1970s, although executions have decreased dramatically over the past two decades. Most executions have been condensed to just a few U.S. states and a few outlier counties.
Read MoreChristianity in the United States is a vibrant and diverse religious landscape. Protestantism is the dominant branch, encompassing a wide range of beliefs and practices, from traditional mainline Protestant denominations like Methodists and Lutherans to more evangelical and charismatic groups.
Read MoreThe United States is a nation of remarkable diversity, with its population representing a wide array of ethnic and racial backgrounds. This rich mix of cultures is reflected in the demographic makeup of each state, creating a fascinating mosaic that tells the story of America’s ever-evolving identity. From the large Hispanic populations in the West to the significant African American presence in the South, each region offers a unique glimpse into the nation’s diversity.
Read MoreEver wonder which terrible movies your state secretly loves? Our map reveals the most popular “bad” films across America, from “The Room” to “The Emoji Movie.” Prepare for some surprising choices and a few nostalgic groans!
Read MoreThe world of international arms transfers is shifting. The US has strengthened its position as the top exporter, while Russia maintains a strong second place. But who’s buying, and how does this affect global politics?
Read MoreEver wondered why your cousin from Georgia calls every soft drink a “Coke”? Or why Midwesterners insist on saying “pop”? Dive into the bubbling world of American soda terminology with two eye-opening maps and a wild list of regional nicknames for our favorite fizzy refreshments.
Read MorePopulation density has been monitored for more than 200 years in the U.S. During this time, the number of people living in the U.S. per square mile has grown from 4.5 in 1790 to 87.4 in 2010. Nowadays, the population density in the United States is 87 per square mile.
Read More