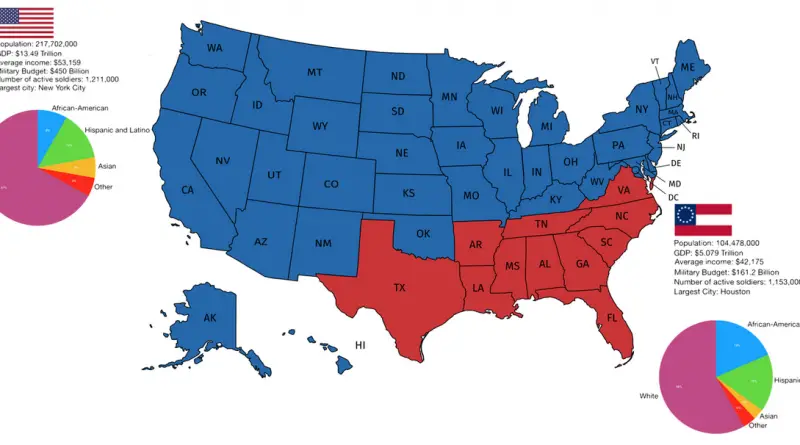
United States

Maps of the US

Climate

The Temperature Extremes That Define America’s Climate

Ever wonder why some U.S. regions experience massive temperature swings while others stay remarkably stable? A fascinating NOAA-based map reveals Colorado’s staggering 69°F (38°C) difference between summer highs and winter lows, while coastal areas like Southern Florida maintain gentle 20-30°F (11-17°C) variations. From Death Valley’s record-breaking 134°F (56.7°C) to Hawaii’s steady 15-20°F (8-11°C) range, discover what creates these dramatic climate differences and how they’re projected to intensify over the coming decades.

Read More
Mapping Stereotypes

Tearing the United States apart

A diverse population has impacted history in the U.S. from the very beginning. From the first travelers and colonists to the modern-day, the United States has been a country of immigrants. Many groups have combined to shape America’s history and give the society that the country has today. Therefore, differences between U.S. states and territories can be significant.

Read More
CitiesSize comparison maps

U.S. States compared to cities similar population

California has about the same population as Tokyo’s entire metro area—40 million people. The difference? California spreads them across a territory 30 times larger. On the flip side, Wyoming has roughly as many residents as Manchester, UK. When you match every U.S. state to a global city with similar population, the results are eye-opening. Texas mirrors China’s Chongqing, Vermont matches Helsinki, and New Jersey equals London.

Read More