Prisioners per 100,000 adults in the United States and Canada
Adults Incarcerated per 100,000 by U.S. State and Canadian Province (and federally for comparison) Related post: – Number of people
Read MoreMaps to explain economic geography.
Adults Incarcerated per 100,000 by U.S. State and Canadian Province (and federally for comparison) Related post: – Number of people
Read More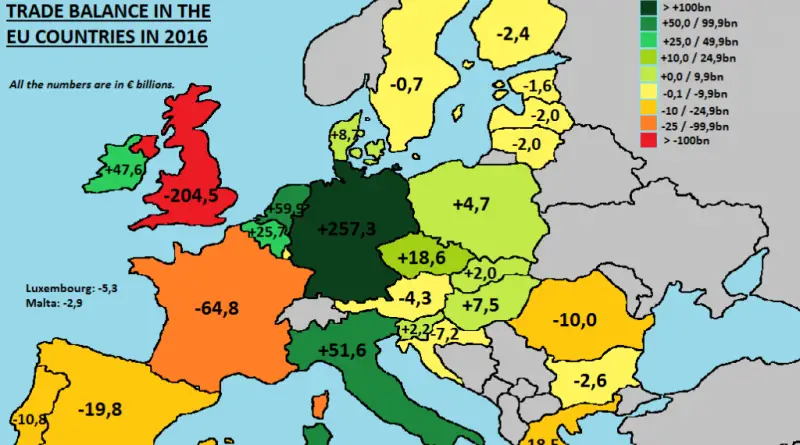
Reddit user: Larelli Source: europe.eu
Read MoreEach European country covers an area of the United States with the same (gross domestic product). The largest/most important cities
Read More

In 1959, only 30% of the world’s population lived in cities. A century later, that will be flipped. By 2050,
Read MoreReddit user: https://www.reddit.com/user/Chief_of_Achnacarry Related post: – How many Luxembourg’s can you fit?
Read MoreThe average annual per capita disposal income by household in China in 2014 was about 20,000 yuan or approximately $3,000,
Read More