The World University Rankings 2016 – 2017
The Times Higher Education World University Rankings 2016-2017 list the 980 top universities in the world, making it our biggest
Read MoreThe Times Higher Education World University Rankings 2016-2017 list the 980 top universities in the world, making it our biggest
Read More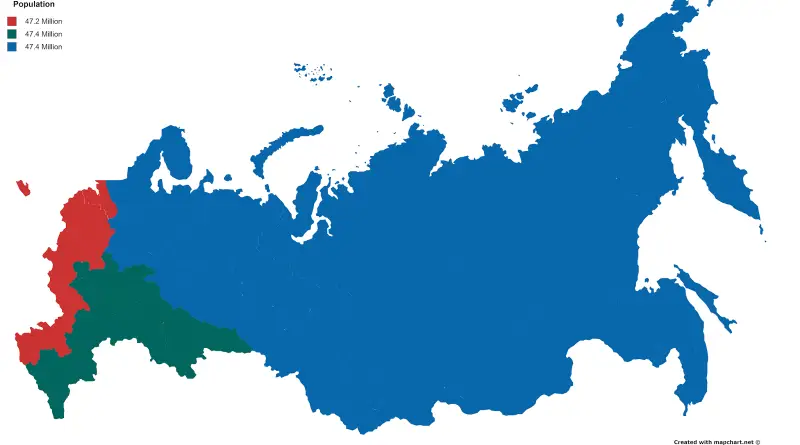
Related post: – China’s population split in half
Read MoreThe New York City Street Tree Map brings New York City’s urban forest to your fingertips. For the first time,
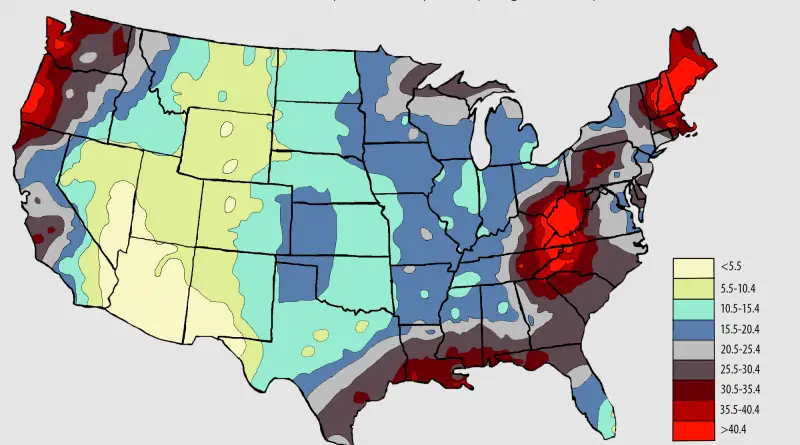
Read MoreSince 1901, the average temperature across the contiguous U.S. states has grown at an average rate of 0.16°F (0.09°С) per decade. Average temperatures have grown more rapidly since the late 1970s (0.31 to 0.54°F or 0.17°С to 0.3°С per decade since 1979). Eight of the top ten hottest years on record for the contiguous U.S. states have happened since 1998, and 2012 and 2016 were the 2 warmest years on record. Over the following few decades (2021–2050), yearly average temperatures are supposed to grow by around 2.5°F (1.39°С) for the U.S., related to the recent past (average from 1976 – 2005), under all probable future climate scenarios.
Read MoreDarker shading denotes higher number of items prescribed per head.
Read MoreThis video will show the entire history of the British Isles from the arrival of modern humans to 2016. Every
Read More