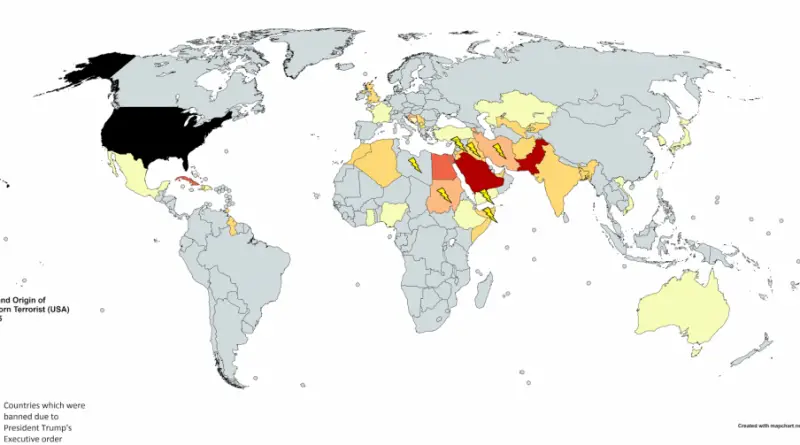
Amount and Origin of Foreign-Born Terrorists (USA), 1975 – 2015
Lightning – Countries which were banned due to President Trump’s executive order. Map created with Mapchart.net
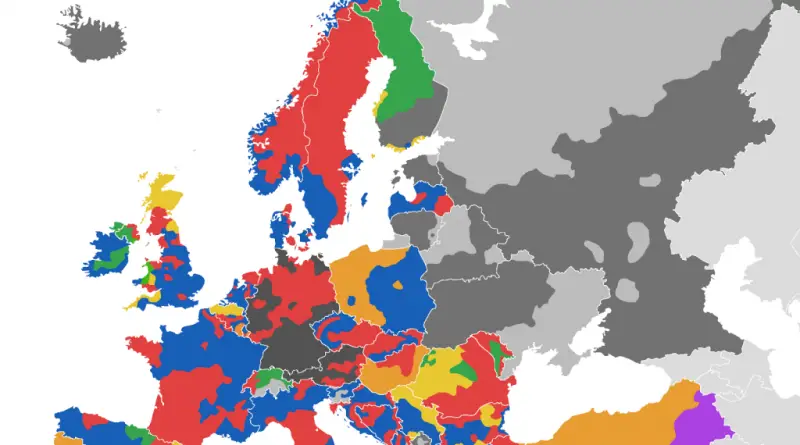
Read MorePolitical Maps show governmental and administrative borders of countries, provinces, states, and counties, the location of major cities, and other political units.
Lightning – Countries which were banned due to President Trump’s executive order. Map created with Mapchart.net
Read More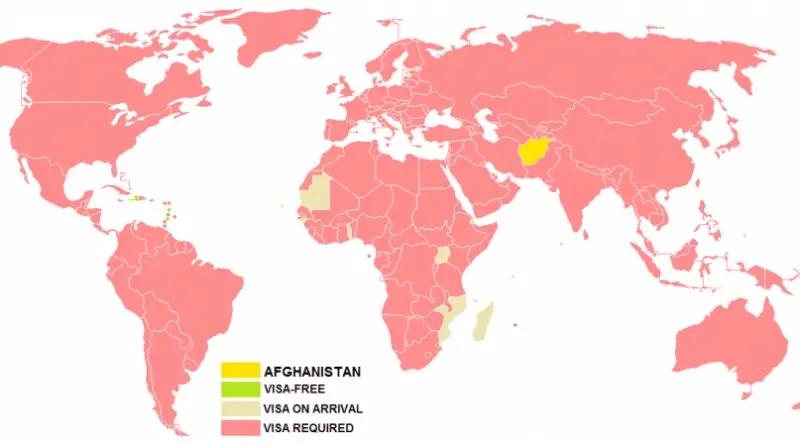
Afghanistan has the least powerful passport in the world.
Read MoreDangerous describes something that encompasses danger. Syria, South Sudan, and Iraq are the most dangerous countries in the world. Other
Read MoreSecurity risk forecast The security risk rating evaluates the likelihood of state or non-state actors engaging in actions that harm
Read More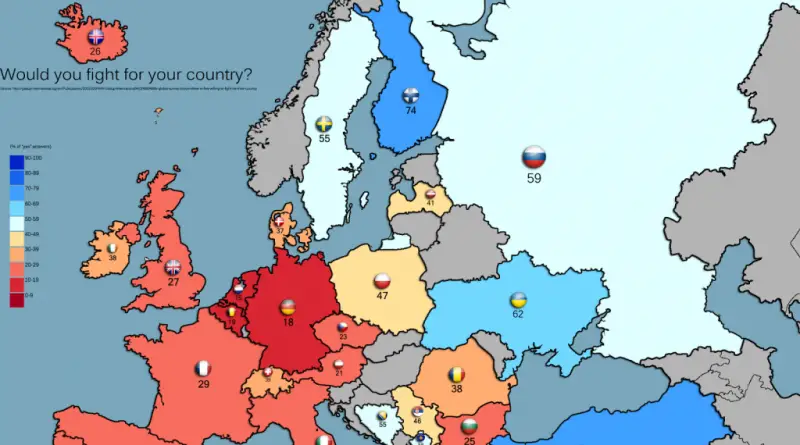
Would you fight for your country? New polling data reveals fascinating changes across Europe since 2017. While Western European countries still show low willingness (Netherlands 15%, Germany 18%), the biggest story is Russia’s dramatic drop from 59% to just 32% — a shift analysts link directly to war fatigue from the Ukraine conflict.
Read More