World Map: Rice vs. Pasta
With a comprehensive world map, you can see how the world is divided between those who prefer pasta and rice, as well as where each dish originates, how eating habits are evolving, and which is healthier.
Read More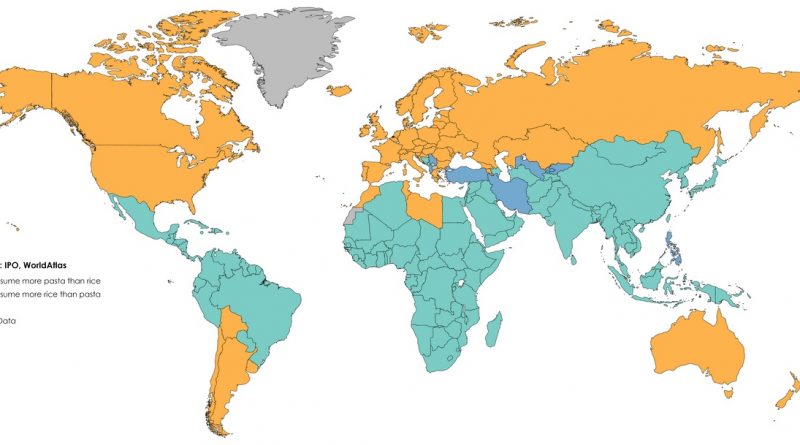
With a comprehensive world map, you can see how the world is divided between those who prefer pasta and rice, as well as where each dish originates, how eating habits are evolving, and which is healthier.
Read More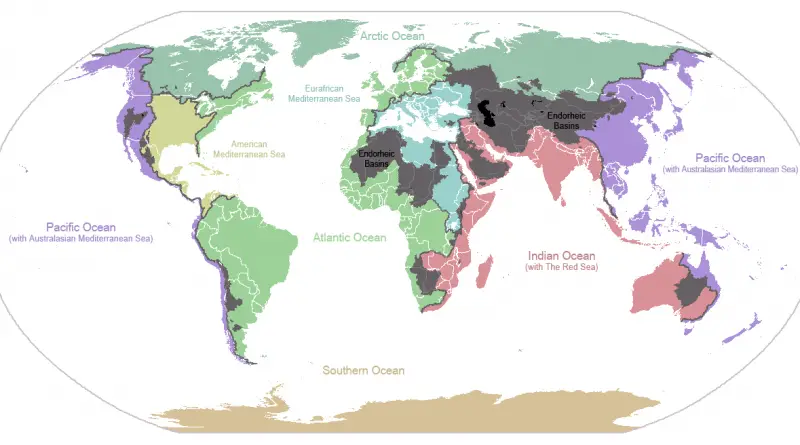
Discover Earth’s ocean drainage basins – vast natural systems that guide water from rain to sea. Explore how these massive networks shape our planet and create unique ecosystems.
Read More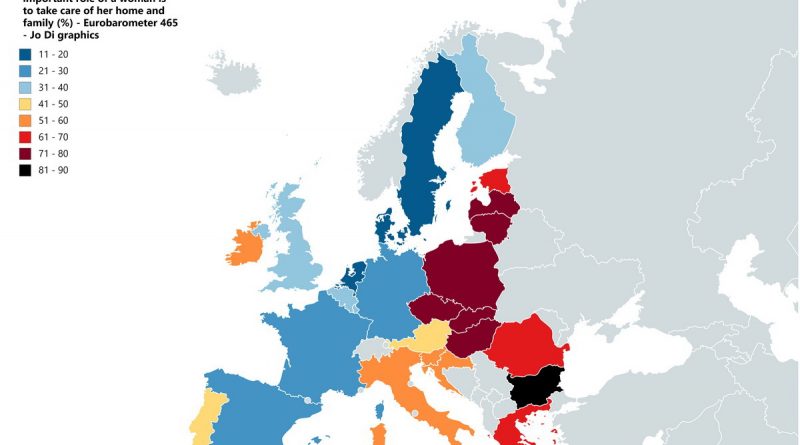
A map of Europe reveals fascinating divides in how countries view women’s roles. See the data behind these cultural attitudes and what they mean for gender equality.
Read More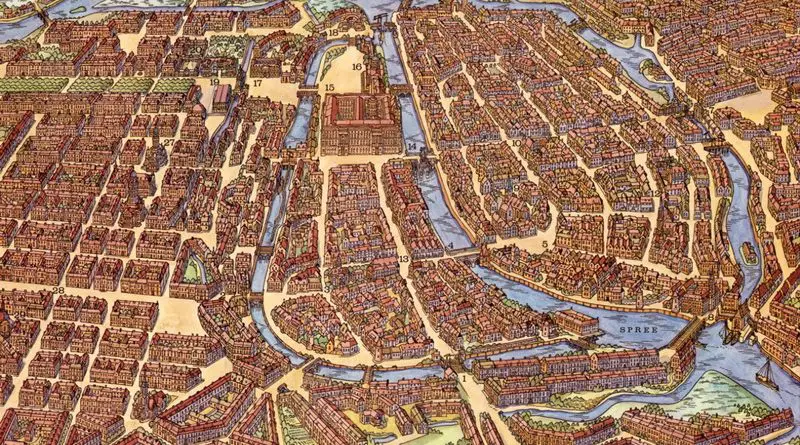
First documented in the 13th century and situated at the crossing of two important historic trade routes, Berlin became the capital of the Margraviate of Brandenburg (1417–1701), the Kingdom of Prussia (1701–1918), the German Empire (1871–1918), the Weimar Republic (1919–1933) and the Third Reich (1933–1945). Berlin in the 1920s was the third largest municipality in the world. Currently, Berlin is the second most populous city (3.7 million residents) proper in the Western Europe behind London and the seventh most populous urban area in the European Union.
Read More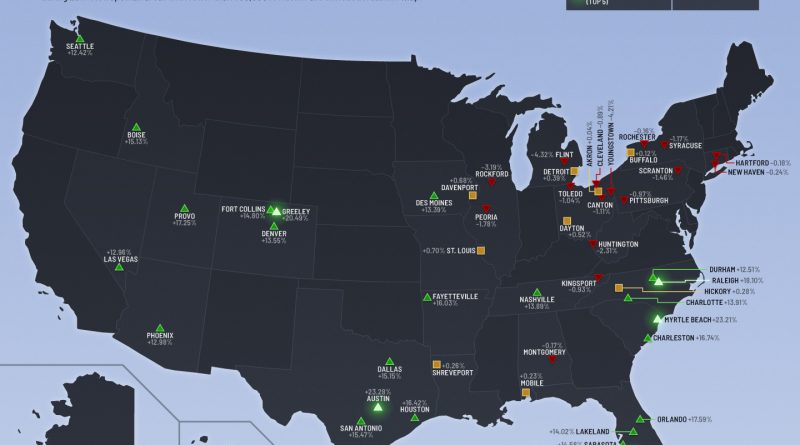
Dive into the shifting demographics of the United States with this post on the fastest- and slowest-growing metropolitan areas since 2010.
Read More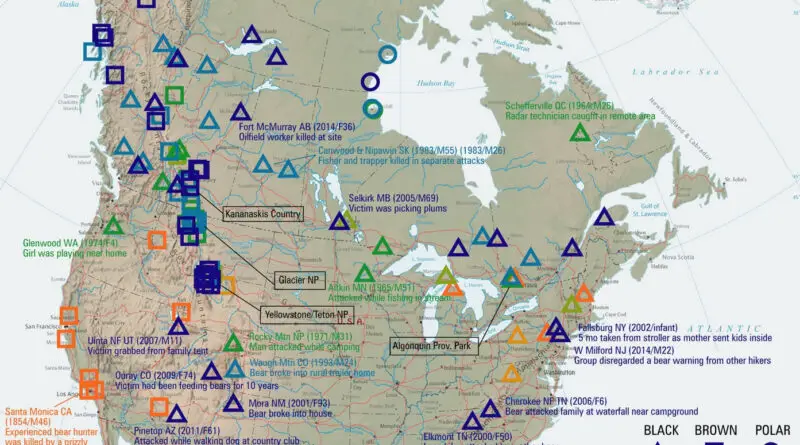
What do maps reveal about fatal bear attacks in North America? Dive into patterns, bear species’ behavior, and practical safety advice for outdoor enthusiasts.
Read More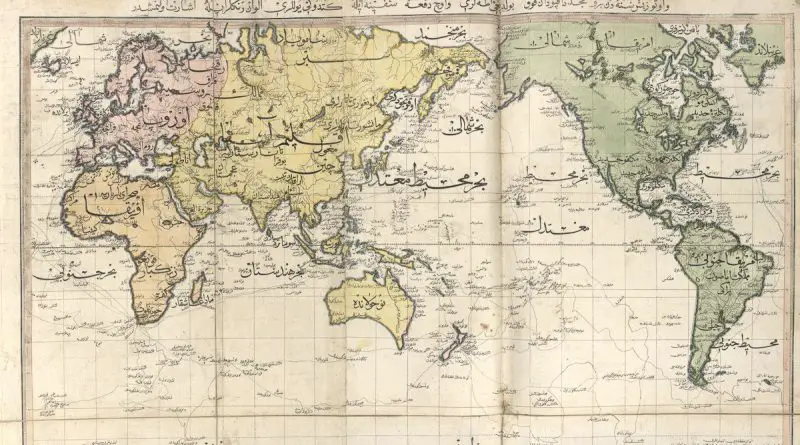
Take a closer look at the fascinating history of Ottoman mapmaking, from Piri Reis’s remarkable works to the empire’s shift toward modern European techniques.
Read More
Climate change is projected to have vastly different economic impacts across U.S. states and counties, with coastal regions facing the heaviest financial burden. Florida and Texas each face potential GDP losses exceeding $100 billion, while states like Vermont and New Hampshire show minimal projected impacts. The analysis reveals that lower-income counties often bear a disproportionate burden of climate-related economic damage, highlighting the need for equitable adaptation policies.
Read More
Operation Barbarossa was the invasion of the USSR by Nazi Germany and many of its Axis allies, starting on Sunday, 22 June 1941, during World War II. The military operation, codenamed after Frederick Barbarossa (“red beard”), a 12th-century Holy Roman emperor and German king, put into activity Nazi Germany’s ideological goal of occupying the western USSR to repopulate it with Germans.
Read More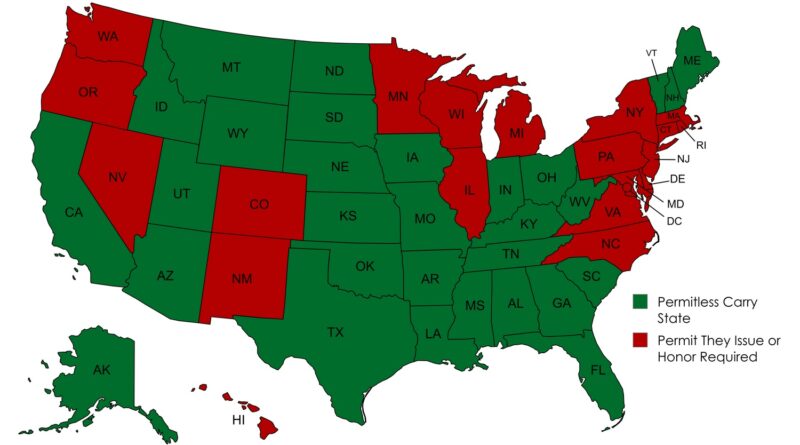
In 2025, 29 states now allow permitless or “constitutional” carry — a major shift in U.S. gun laws over the past two decades. The updated map shows where these laws apply, how states differ on open vs. concealed carry.
Read More