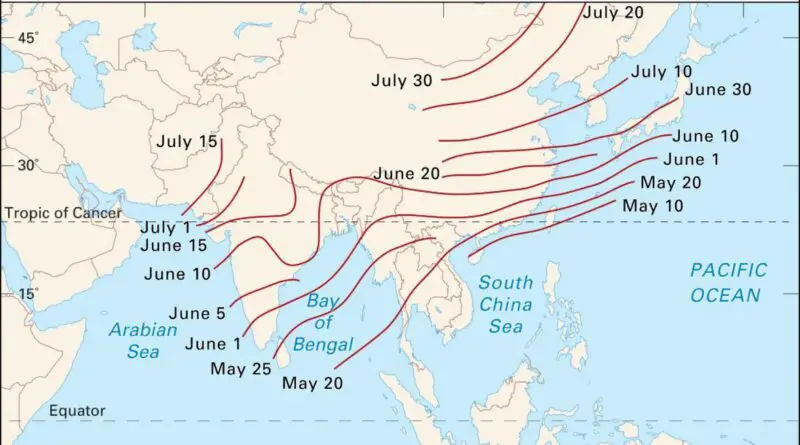
Skip to content
Vivid Maps Logo

  • Atlases
  • Map Posters
  • Scratch Maps
  • Globes
  • Videos
World map of countries based on share of immigrants
DemographyNewsVivid maps

Mapped: Countries With the Lowest Percentage of Immigrants

June 18, 2025 Alex
United States border elevation maped
Environment mapsNewsPolitical mapsVivid maps

United States Border Walls

May 21, 2025 Alex
Cash in the banks by U.S. state mapped
Economic mapsNewsVivid maps

States Where Americans Have the Most Cash in the Bank

May 5, 2025 Alex
Mapped: Which Countries Get the Most Paid Time Off Overall
Economic mapsJob

How Paid Vacation Varies Around the World

August 5, 2025 Alex
Countries wealthier than the global average mapped
Economic maps

Which Countries Are Wealthier Than the Global Average?

July 27, 2025 Alex
Siesta in world countries mapped
Cultural cartography

Siesta Nations: A Map of Midday Rest Traditions Around the World

July 19, 2025 Alex
Difference between male and female BMI by country mapped
Health

Who Has Higher BMI: Men or Women?

June 25, 2025 Alex
Interactive mapsMapping StereotypesPolitical maps
February 13, 2016 Alex

Good Country Index

The Good Country Index measures how much each of the 125 countries on the list contribute to the planet and

Read More
CitiesSatellite MapsSlider
February 13, 2016 Alex

Satellite Bird’s Eye View of San Francisco

This is an incredible hi-res bird’s eye view of San Francisco taken by DigitalGlobe’s WorldView-3 satellite. WorldView-3 is about 17°

Read More
Animated chartsChartsDemographyForecastsMapping StereotypesPopulation
February 13, 2016 Alex

Population structure of Poland during the 1960-2060 period

Related posts: – Population structure of Sweden during the 1960-2060 period – Population structure of Spain during the 1960-2060 period

Read More
Animated chartsChartsDemographyEnvironment mapsForecastsLawsMapping StereotypesPollutionPopulation
February 13, 2016 Alex

Population structure of Sweden during the 1960-2060 period

Related posts: – Population structure of Spain during the 1960-2060 period  – Population structure of Turkey during the 1960-2060 period

Read More
Economic mapsInteractive mapsWorld
February 13, 2016 Alex

Percent of Working-Age Population

Read More
Economic mapsMapping Stereotypes
February 13, 2016 Alex

Unemployment rate by U.S. county (2007 – 2014)

Read More
AgricultureEnvironment maps
February 13, 2016 Alex

Cattle density by U.S. coutny

Read More
AgricultureInteractive mapsPolitical mapsSlider
February 13, 2016 Alex

Election outcome in counties with more cattle than people

Read More
Real estate
February 13, 2016 Alex

% of housing units used for Recreational/Seasonal purposes by US Zip Code

Read More
Economic mapsSlider
February 13, 2016 Alex

How much does your state spend on Valentine’s Day gifts?

A new study from Finder.com surveyed more than 3,000 people across the country, and asked them how much they planned

Read More
Page 435 of 672« First«...102030...433434435436437...440450460...»Last »

Trending now

  • Nations with over 20% of the population aged 65+ years mapped
    The World Is Aging: Which Countries Have Over 20% of People Aged 65+?
  • How Buddhism Spread Across Asia: Trade, Teaching, and Time

Related Products

Push pin maps · Globe drinks cabinets · Maps of the United States · Board games · Monopoly · Map-based strategy board games · History Board Games · Coloring Books · Handheld GPS · GPS Watches · GPS Trackers

Vivid Maps Tools

· Convert Latitude/Longitude
· Elevation Finder
· Distance Calculator
· Kilometers to Miles Converter
· Kilograms to Pounds Converter
· Liters to Gallons Converter
· Temperature Converter
· Find cities with a similar climate
· Find cities with a similar climate (2050)
· How hot cities could be in 2050
· The U.S. Population Lines

About
Privacy Policy

Copyright © 2025 Vivid Maps. All rights reserved.