U.S. Political Donations
www.mapd.com/demos/political-donations/#/dashboard?_k=3d5zxp
Read MoreMaps of the US
www.mapd.com/demos/political-donations/#/dashboard?_k=3d5zxp
Read More
The U.S. split into the areas dominated by fans of each NFL team The U.S. split into the areas dominated
Read More
The world population has reached 8 billion people as of November 2022 and is still growing. Population size varies at differing rates in different regions. The maps below show different ways of dividing the Earth, continents, and countries into areas of equal population.
Read More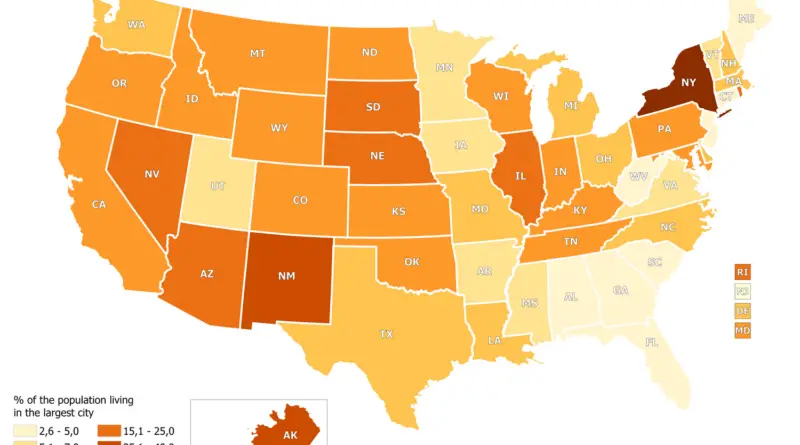
In most U.S. states, less than 20 percent of the population lives in the largest city. In South Carolina and West Virginia, even less than 3% of the population lives in the largest city. The highest percentage of the state’s population lives in New York City (New York) – 41.30% and Anchorage (Alaska) – 39.52%.
Read MoreThe New York City Street Tree Map brings New York City’s urban forest to your fingertips. For the first time,
Read MoreTrump – 18 – Arizona – Florida – Georgia – Indiana – Maryland – Michigan – Minnesota – New Mexico
Read More
Via flowingdata.com Related posts: – Prevalence of self-reported obesity among non-hispanic white adults by U.S. state (2012 – 2014) –
Read More
Since 1901, the average temperature across the contiguous U.S. states has grown at an average rate of 0.16°F (0.09°С) per decade. Average temperatures have grown more rapidly since the late 1970s (0.31 to 0.54°F or 0.17°С to 0.3°С per decade since 1979). Eight of the top ten hottest years on record for the contiguous U.S. states have happened since 1998, and 2012 and 2016 were the 2 warmest years on record. Over the following few decades (2021–2050), yearly average temperatures are supposed to grow by around 2.5°F (1.39°С) for the U.S., related to the recent past (average from 1976 – 2005), under all probable future climate scenarios.
Read MoreResults may fluctuate throughout the day. Votings ends on November 4th, 2016 Source: www.vote.studiesweekly.com
Read More