The U.S. Population Fitted in Europe and Vice Versa
European Countries Population Fitted into the United States The map below shows how the US population fits in Europe. The
Read MoreMaps of the US

European Countries Population Fitted into the United States The map below shows how the US population fits in Europe. The
Read More
Reddit user: tseepra
Read More
A number of adherents per congregation (1890 – 2010) Youtube A number of adherents per congregation, 2010 www.vividmaps.com Related post:
Read MoreSunlight duration in hours per year in the continental United States and Europe. Related posts: – Annual sunshine hours map of
Read More
Los Angeles County is the first in the country to reach 10 million inhabitants. If the Los Angeles five-county area were a state, it would exceed all states in total population size except California, Texas, New York, and Florida. The County of Los Angeles alone would be the 7th most populated state.
Read MoreReddit user: trinitronbx
Read More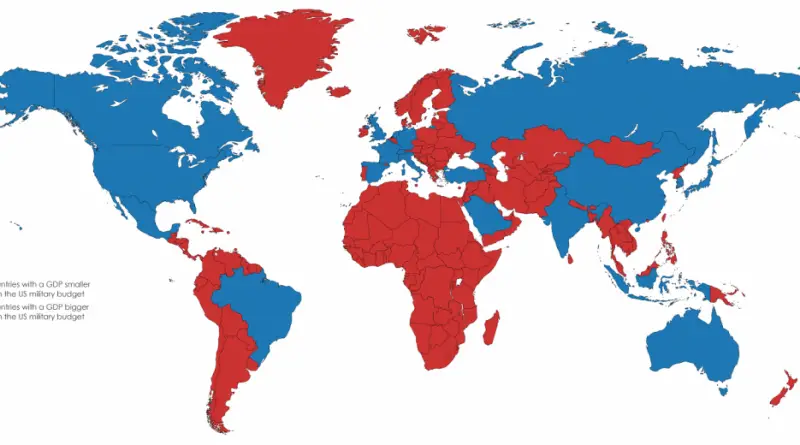
In 2020 the military budget of the United States was about $721.5 billion. It is the largest military budget in the world.
Read MoreReddit user: Irmfried
Read More
“States of integration estimated figures for public grade and high schools.”
Read More
Via metricmaps
Read More