Political maps

Political Maps show governmental and administrative borders of countries, provinces, states, and counties, the location of major cities, and other political units.

Political maps

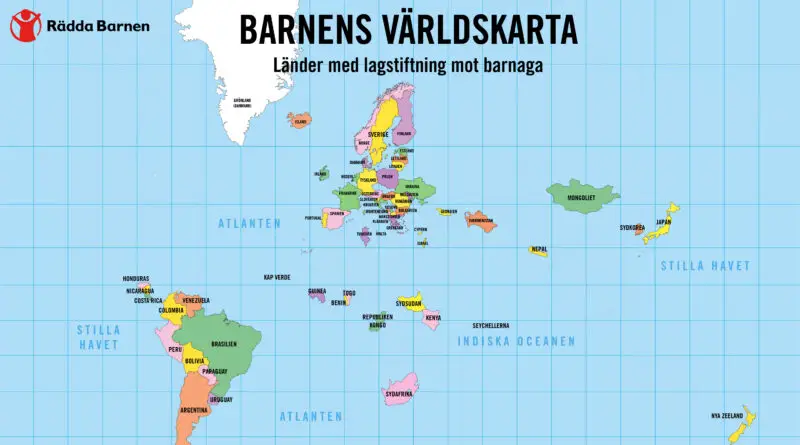
Children Archipelago

Violence toward children crosses boundaries of geography, race, social status, education, religion, and culture. It happens in homes and streets, schools, orphanages, and other care centers, places of work, and entertainment. Perpetrators include family members, caretakers, teachers, law enforcement officials, and other kids. Some children are especially unsafe because of disability, gender, nationality, ethnic origin, class. And no nation is exempt, whether wealthy or poor.

Read more: Children Archipelago
NewsPolitical mapsVivid maps

2020 U.S. Election Mapped: TrumpLand vs Biden Archipelago

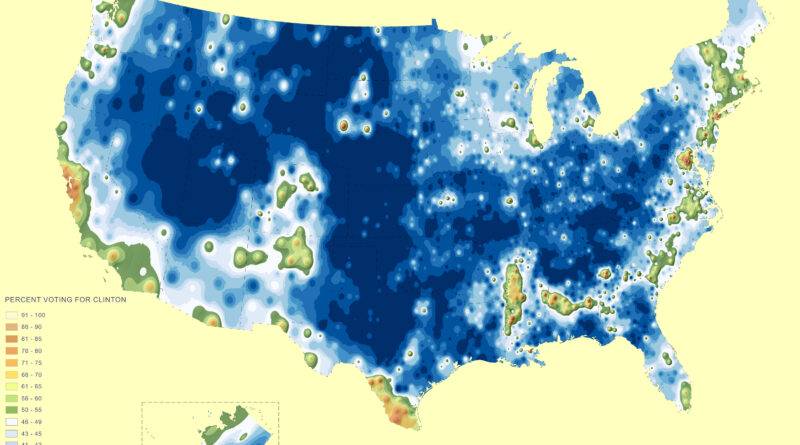
The 2020 U.S. presidential election revealed stark contrasts in how Americans vote based on where they live. These original maps show Biden’s urban archipelagos – centers of economic power generating 70% of U.S. GDP – scattered across Trump’s expansive heartland. From county-level analysis to population-weighted visualizations, these maps tell the story of two Americas: one concentrated in high-density cities, another spread across the rural landscape. Building on my viral 2016 electoral maps, this new series offers fresh insights into our nation’s deepening political geography.

Read more: 2020 U.S. Election Mapped: TrumpLand vs Biden Archipelago
NewsPolitical mapsVivid maps

What if “Did Not Vote” were a candidate in the 2020 U.S. Presidential Election?

Joe Bide has been elected the 46th president of the U.S., In 2020, he has enlarged Hilary Clinton’s record from 51 to 162 electoral votes, while Donald Trump has raised from 16 to 98 votes. But many Americans still didn’t vote. What if “I didn’t vote” ran as a U.S. presidential candidate in the 2020 election?

Read more: What if “Did Not Vote” were a candidate in the 2020 U.S. Presidential Election?