Winter Holiday Spending per Capita by State
www.titlemax.com Most spent per capita 1.New Hampshire – $1,567.39 2. Vermont – $1,249.85 3. Delaware – $1,213.54 4. Nevada –
Read More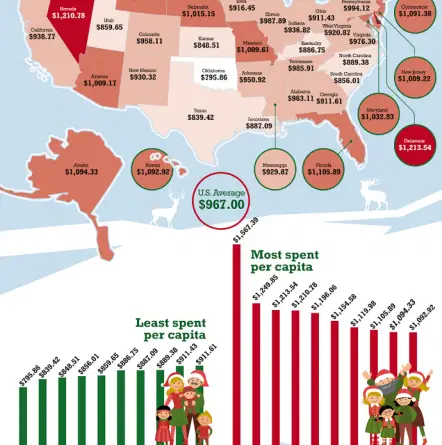
www.titlemax.com Most spent per capita 1.New Hampshire – $1,567.39 2. Vermont – $1,249.85 3. Delaware – $1,213.54 4. Nevada –
Read MoreBetween 1378 and 1417, three men simultaneously claimed to be pope. European kingdoms divided over allegiances to Rome, Avignon, and Pisa, driven purely by political interests rather than religious disagreements.
Read MoreThe Tory Atlas is a map plastered with nicknames instead of country names, showing how British conservatism colored attitudes towards the rest of the world.
Read More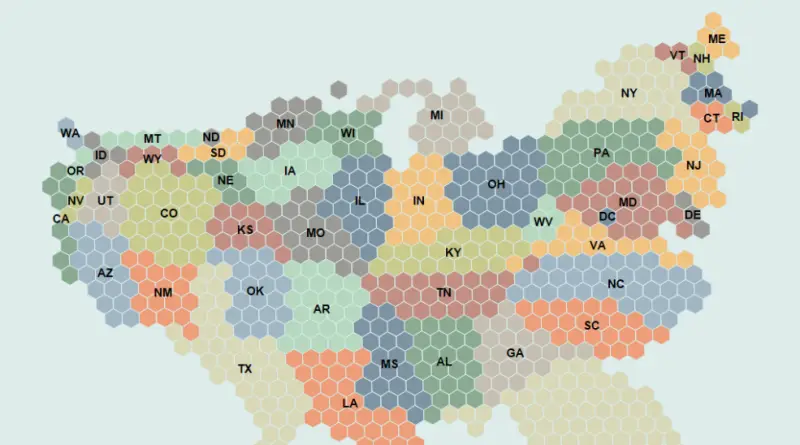
Since 2006, Florida has recorded 94 lightning deaths, more than any other US state. Texas has 41 fatalities, Colorado 25. Men account for 80% of victims, with fishing and boating being the deadliest activities.
Read More
An animated map shows what would happen if you pulled a 10-meter plug in the Mariana Trench. Over 158,180 years, the Atlantic and Indian Oceans become landlocked while the Pacific keeps draining toward the deepest point on Earth.
Read More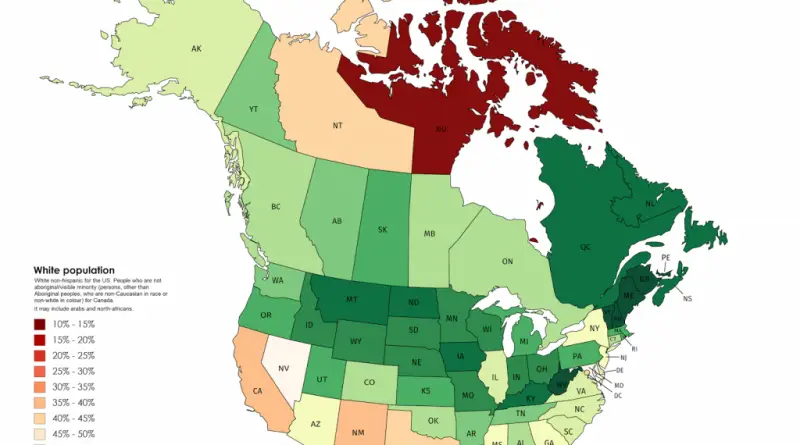
New Brunswick 90.16%, Vermont 89.3%, West Virginia 89.14%. Atlantic Canadian provinces and rural American states have the highest white population shares in North America. Post-1970s immigration concentrated in Toronto, Vancouver, and major U.S. gateway cities, leaving these regions demographically unchanged.
Read More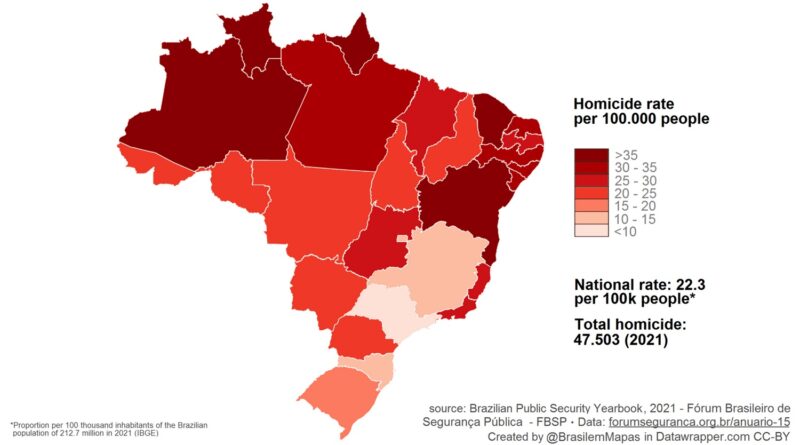
Brazil loses roughly 60,000 people to homicide each year. While Amapá and Bahia struggle with rates above 44 per 100,000, São Paulo has dropped to just 7.9. The state-by-state differences are enormous, and tracking them from 1980 to 2021 shows how unevenly violence has changed across the country.
Read More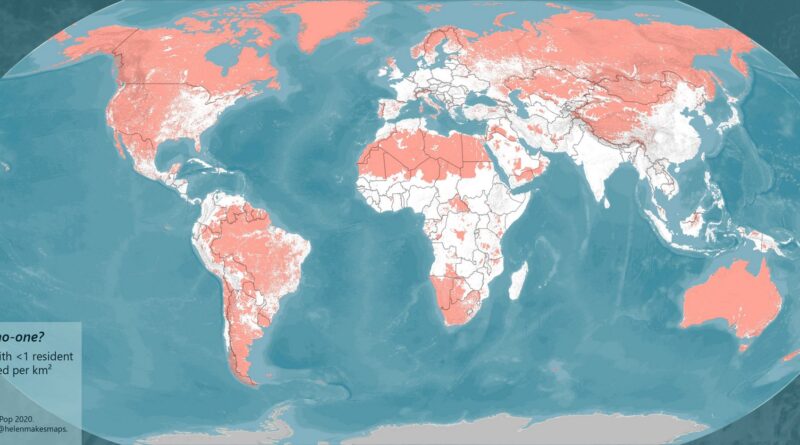
Only 5% of global landmass remains untouched by human activity. These maps show uninhabited areas across nine countries, plus global wilderness zones with minimal human footprint. Even in densely populated Netherlands, green spaces persist where no one lives.
Read More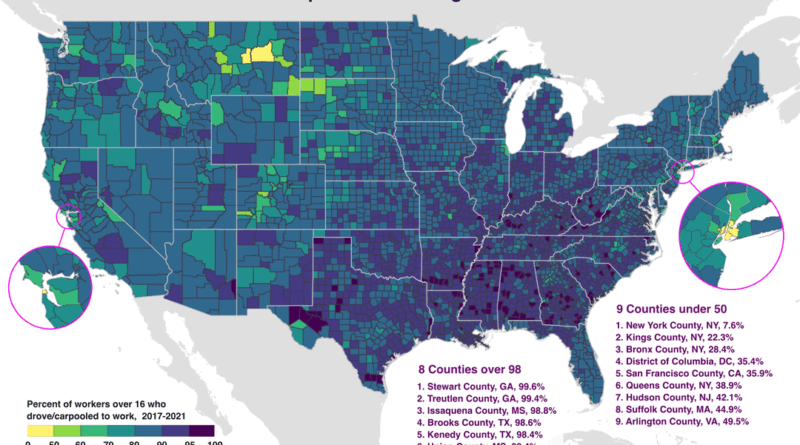
In Stewart County, Georgia, 99.6% of workers drive to their jobs. In Manhattan, just 7.6% do. This map using Census Bureau data from 2017-2021 shows which American counties are most car-dependent and where alternatives exist. Eight counties exceed 98% driving rates, all in rural areas. Nine counties fall below 50%, concentrated in dense urban centers with transit systems.
Read More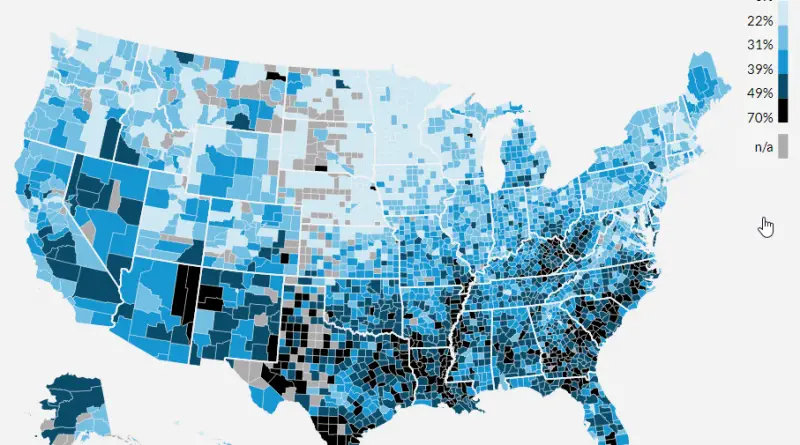
Which US states saw household debt skyrocket relative to income over the past 25 years? The answer might surprise you. Delaware leads with a stunning 105% increase, while some states like California actually saw their ratios improve.
Read More