6 months of drought in the Amercan Southeast
Drought intensity & frequency from June – November of 2016. Via esri.com
Read MoreDrought intensity & frequency from June – November of 2016. Via esri.com
Read MoreThis video will show the history of mainland France from the ascension Hugh Caper from 987 to 2016. Included also
Read MoreVia worldpolicycenter.org
Read MoreVia img.zeit.de
Read MoreReddit user: q1s2e3
Read More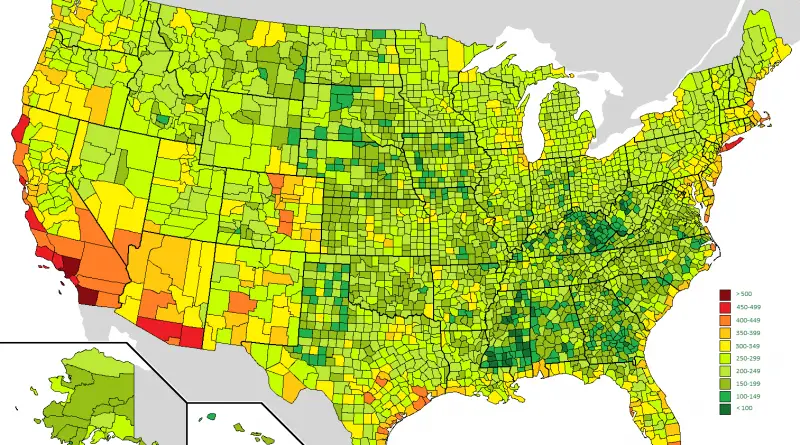
Reddit user: buttfuck_warbler California has the highest numbers of bird species of any state.
Read MoreReddit user: bezzleford
Read MoreVia austromorph.space
Read More
Reddit user: BuddyWudd
Read More