Skip to content
Vivid Maps Logo

  • Atlases
  • Map Posters
  • Scratch Maps
  • Globes
  • Videos
SubwayTransportVoronoi maps
September 30, 2016 Alex

The subway of New York City as a Voronoi tessellation

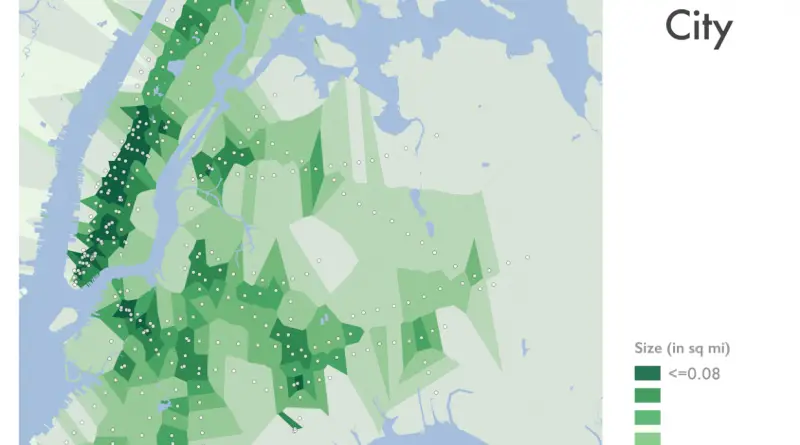
Related posts: – New York’s Subway Deserts – New York City boroughs journey to work-driving ca alone vs. walk/public transportation – New York

Read More
DemographyMapping StereotypesTechnology
September 30, 2016 Alex

The generations of the United Kingdom

Via sheffield.ac.uk

Read More
Interstate migrants in the U.S.
InfographicsMigration maps
September 29, 2016 Alex

Mapping Interstate Migration

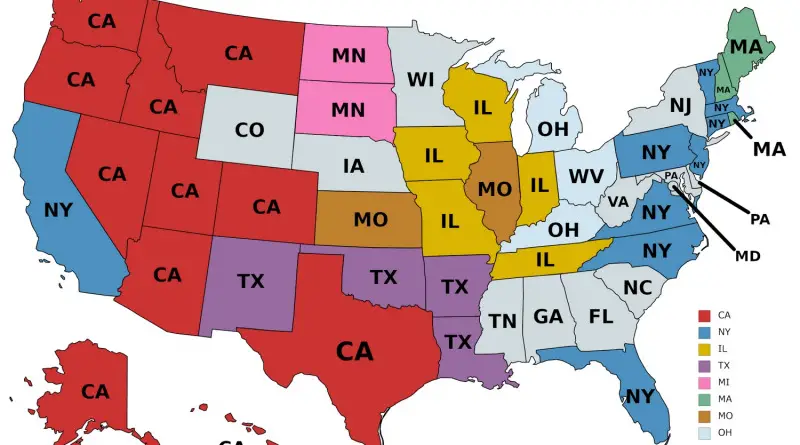
Millions of U.S. citizens migrate between states every year. According to Internal Revenue Service data, about 3% of households moved to another state. People are mainly moving out of the Northeast and Midwest to the South and West, but they are also leaving California.

Read More
Economic mapsInfographicsNaturePolitical mapsSlider
September 29, 2016 Alex

The United States foreign-aid budget

The $50.1 billion proposed foreign-aid budget for 2017. Unites States humanitarian aid United States military aid Via washingtonpost.com Related post:

Read More
CarsEnvironment maps
September 29, 2016 Alex

Emissions produced by an electric car per 1 km

The carbon footprint of a  gasoline car (180 gCO2e/km) or diesel car (170 gCO2e/km), which are currently the most common

Read More
Cultural cartography
September 29, 2016 Alex

The most famous mythical creatures of America

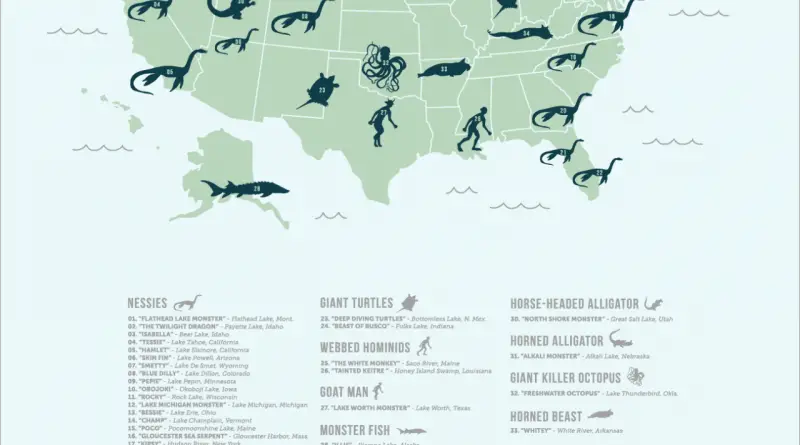
Many U.S. residents are convinced that mystical animals inhabit the territory in addition to the usual animals and plants. Some

Read More
Interactive mapsMapping Health
September 29, 2016 Alex

Malaria & Population Density in Africa

Read More
SliderSociologySubwayVideoWorld
September 29, 2016 Alex

Map of geo-social division

Read More
ChartsGlobal Warming
September 29, 2016 Alex

Carbon Dioxide Moves Permanently Above 400 PPM

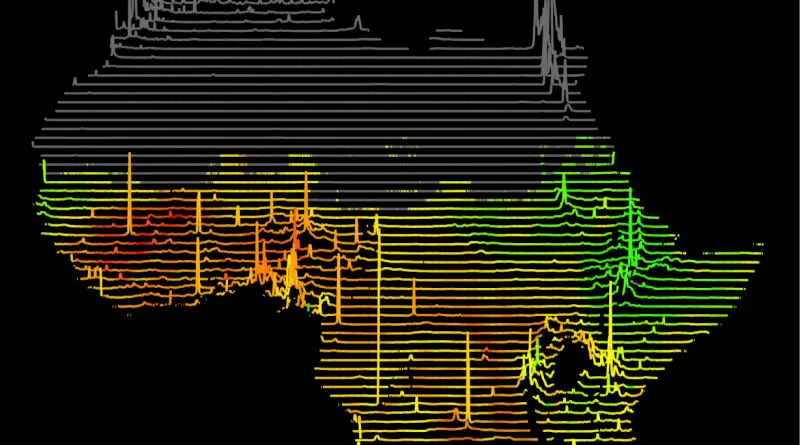
September is usually the month when CO2 is at its lowest after a summer of plants growing and sucking it

Read More
Education
September 28, 2016 Alex

Primary school enrollment (1820 – 2010)

Estimated enrollment ratios for total population aged 15-64, primary education level. Via ourworldindata.org

Read More
Page 298 of 675« First«...102030...296297298299300...310320330...»Last »

Trending now

  • The Price of Sex around the World Mapped
  • The most used Emoji in every country
    The Most Used Emoji on Twitter in Every Country Mapped

Related Products

Push pin maps · Globe drinks cabinets · Maps of the United States · Board games · Monopoly · Map-based strategy board games · History Board Games · Coloring Books · Handheld GPS · GPS Watches · GPS Trackers

Vivid Maps Tools

· Convert Latitude/Longitude
· Elevation Finder
· Distance Calculator
· Kilometers to Miles Converter
· Kilograms to Pounds Converter
· Liters to Gallons Converter
· Temperature Converter
· Find cities with a similar climate
· Find cities with a similar climate (2050)
· How hot cities could be in 2050
· The U.S. Population Lines

About
Privacy Policy

Copyright © 2025 Vivid Maps. All rights reserved.