


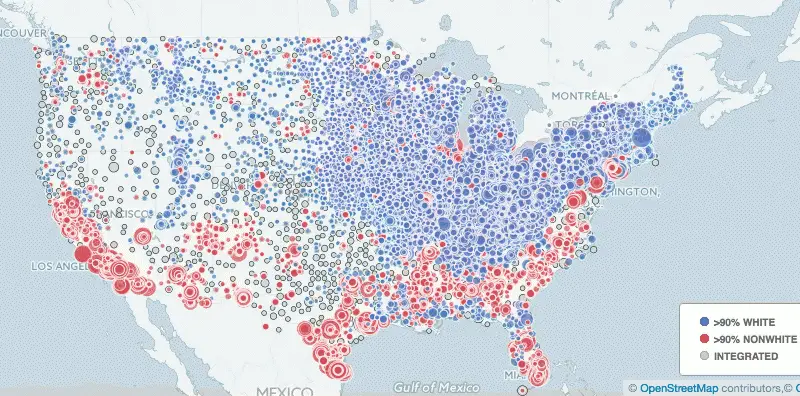
The new face of segregation in schools
Based on an analysis we conducted of data from the National Center for Educational Statistics, we found that approximately a
Read More


Based on an analysis we conducted of data from the National Center for Educational Statistics, we found that approximately a
Read More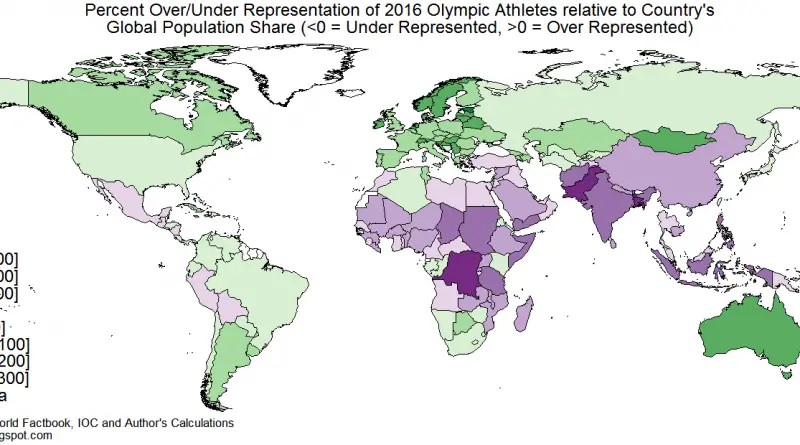
Physically gifted people are extremely unevenly distributed. The number of successful athletes depends on many factors: genetic traits, the wealth of the country, and the quality of sports education and sports pharmacology. The maps below illustrate the countries with the greatest concentration of athletic talent.
Read More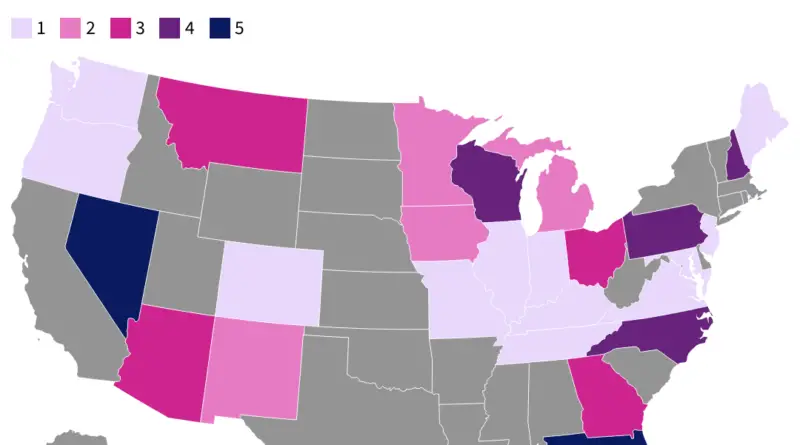
Dive into the dynamic landscape of American swing states. From humorous maps to serious analysis, learn how these crucial battlegrounds shape presidential elections and why they’re essential for understanding electoral politics.
Read More
Below is a map illustrating the ethnic diversity of the United States, created using 2017 Census data. The diversity index
Read MoreTop Countries by Inbound Tourism Expenditure – United States: $220.1B – France: $66.8B – Spain: $65.1B – United Kingdom: $62.8B
Read More
Related posts: – 2016 Olympics delegation size by nation – Residents per 2016 Olympic athlete – Rio Olympics 2016: Participants
Read MoreRelated post: – Buried ships along San Francisco`s waterfront
Read MoreCity flows is a comparative visualization environment of urban bike mobility designed to help citizens casually analyze three bike-sharing systems
Read More
The middle class in the United States has shrunk since 2000. Stateline analysis reveals that in all 50 states, the
Read More