Evolution of the United States (1783 – 2014)
Related post: – Why is Canada not part of the United States?
Read MoreMaps of the US
Related post: – Why is Canada not part of the United States?
Read MoreDrought intensity & frequency from June – November of 2016. Via esri.com
Read MoreReddit user: q1s2e3
Read More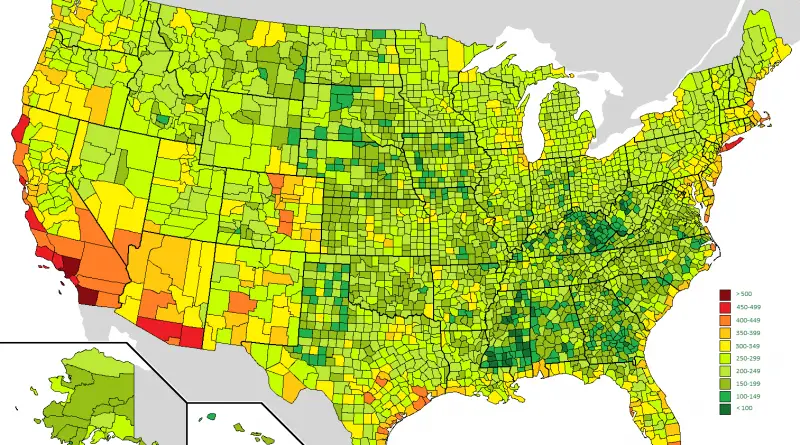
Reddit user: buttfuck_warbler California has the highest numbers of bird species of any state.
Read More“Map showing the distribution of the slave population of the Southern States of the United States. Compiled from the Census
Read MoreMaritime traffic in and around the US Airports Bridges The electric grid Pipelines Railroads Via washingtonpost.com Related post: – An
Read More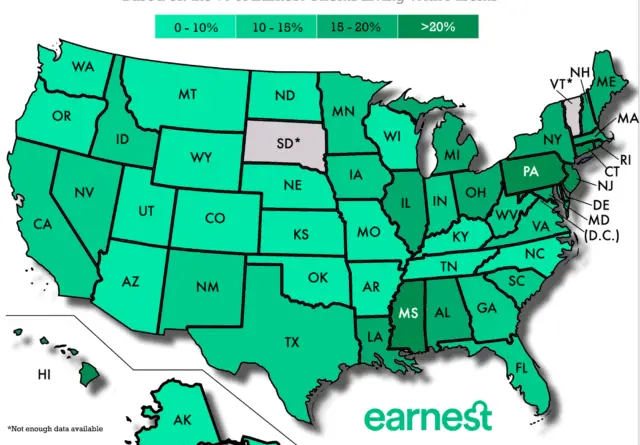
Uncover why many young adults in the United States still live with their parents, with insights into historical trends, and mental health impacts. Explore this topic with our detailed map of the United States.
Read MoreBy Reddit user: Mainstay17
Read MoreWhile Hillary Clinton got about 2.9 million more votes general, a margin of 2.1 percent of the total cast, Donald Trump conquered supremacy in the Electoral College, winning 30 U.S. states with 306 pledged electors out of 538, and reversed the permanent swing states of Florida, Ohio, and Iowa, as well as the “blue wall” of Michigan, Wisconsin, and Pennsylvania, which had been Democratic citadels in presidential elections since the 1990s.
Read MoreA simulation of a U.S. style presidential vote using the 2014 European elections on a winner-takes-all system, with the biggest
Read More