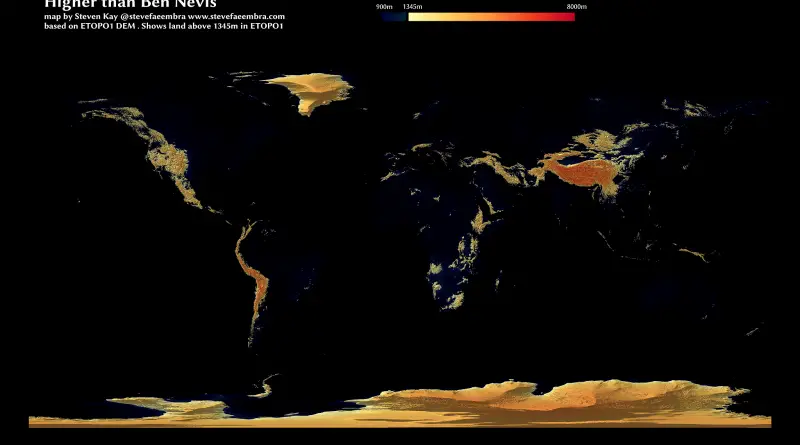
Higher than Ben Nevis (the highest point in the UK)
Via stevefaeembra
Read MoreThe vote across the Mexican border
Via elpais.com Related posts: – U.S. counties in which party of top vote-getter changed between 2000 & 2016 presidential elections
Read More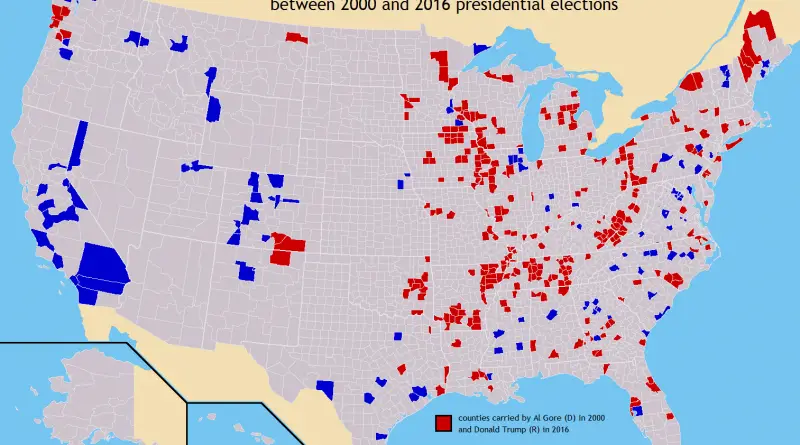
U.S. counties in which party of top vote-getter changed between 2000 & 2016 presidential elections
Related posts: – U.S. Presidential Election 2016 (Cartogram) – How America voted in every election (1824 – 2016) – The
Read More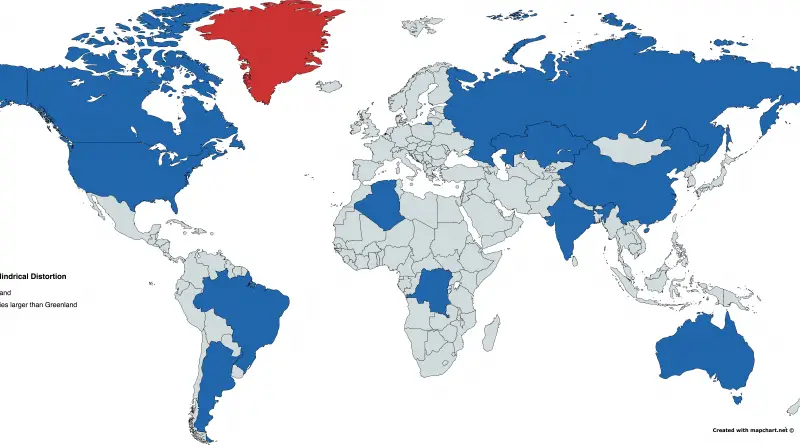
Miller-Cylindrical projection distortions
Red: Greenland Blue: Countries larger than Greenland
Read MoreThe disappearance of San Francisco’s middle-class neighborhoods (1990 – 2010)
Related posts: – Mapping Displacement and Gentrification in the San Francisco Bay Area – America’s great housing divide: Are you
Read More