General Sales Tax by U.S. County Mapped
Discover how U.S. sales tax rates have changed from 2022 to 2025, with insights into state and local adjustments and their broader impacts.
Read more: General Sales Tax by U.S. County Mapped
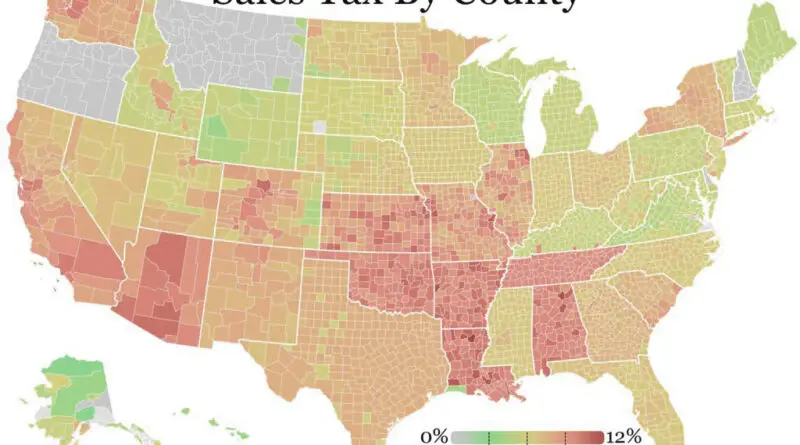
Discover how U.S. sales tax rates have changed from 2022 to 2025, with insights into state and local adjustments and their broader impacts.
Read more: General Sales Tax by U.S. County Mapped
Every NYC neighborhood has its local characters – including superheroes. Find out which defenders might be watching over your corner of the city.
Read more: The Superheroes Who Protect NYC: Powerful Characters Roaming the Big Apple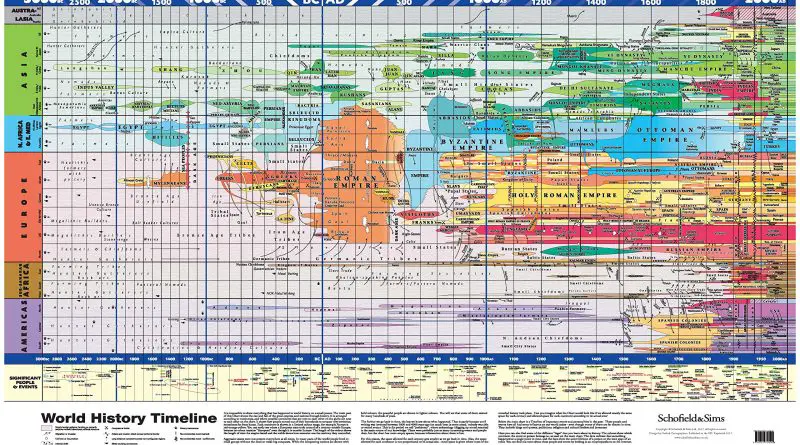
Is it possible to show everything that has happened in world history on one map poster? The diagrams below are excellent attempts to depict countries and their time of existence and the lifetime of influential historical figures on one map.
Read more: World History Timeline
The American housing market has changed significantly, altering the traditional rent-versus-buy equation. While homeownership was once considered the best financial move, rising costs have flipped the script in many places. Explore what’s behind this shift and see how your city compares.
Read more: Is It Cheaper to Rent or Buy?
In 1900, reaching 65 was a rare achievement. Today, most of us will celebrate our 65th birthday and beyond. But this remarkable change hasn’t happened equally for everyone – here’s what our maps reveal about who lives longer, where, and why.
Read more: Living Past 65: How Life Expectancy Differs for Men and Women Around the World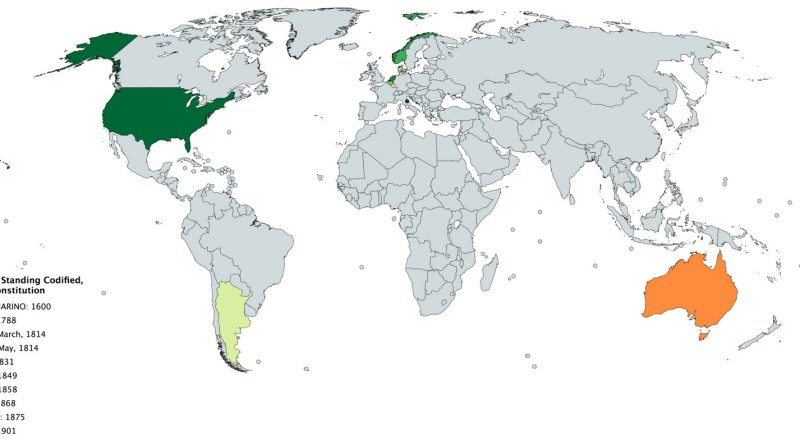
Dive into the fascinating history of the world’s oldest constitutions still in effect. From San Marino’s 1600 statutes to Australia’s 1901 constitution, explore how these foundational documents have guided nations through centuries.
Read more: The Top 10 Oldest Codified Constitutions Still in Use Today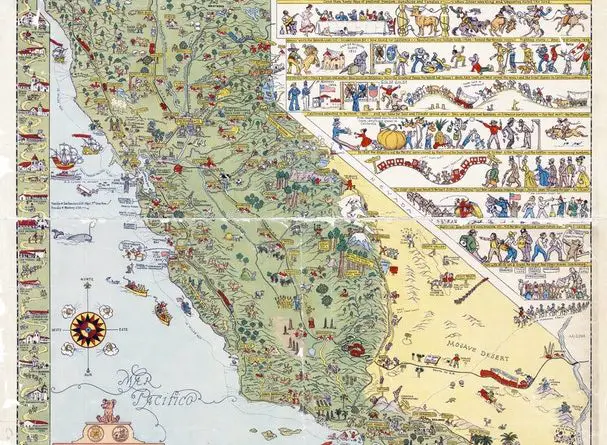
Explore the charm of Jo Mora’s 1927 Illustrated Tourist Map of California. With intricate details, historical insights, and a touch of humor, this vintage map captures the spirit of the Golden State. A must-see for history buffs and map lovers alike!
Read more: Discovering California Through a 1927 Illustrated Tourist Map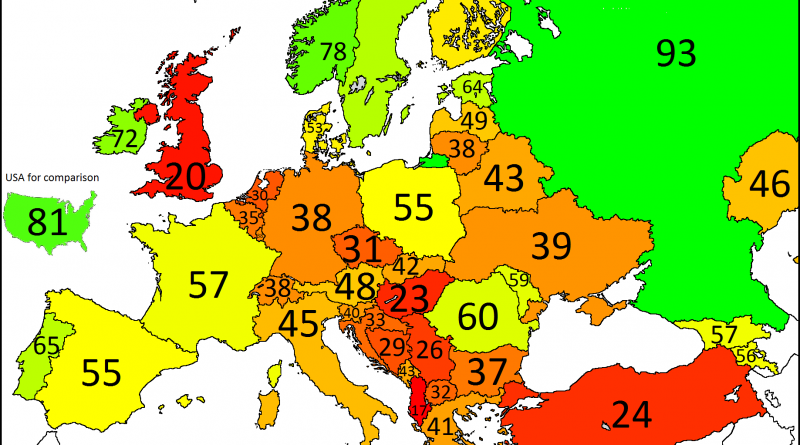
How does your purchasing power for transportation vary depending on where you live? This analysis reveals striking disparities across Europe, where a day’s salary in Russia lets you travel 93 kilometers (58 miles) by taxi, while in the UK it covers just 20 kilometers (12.4 miles). Even more dramatic are the differences in fuel purchasing power: a Swiss monthly salary buys 3,240 liters (856 gallons) of gasoline, while Moldova’s average wage gets just 233 liters (62 gallons). Through three detailed maps, we explore these transportation inequalities and their implications for daily mobility across different regions. The data reveals fascinating patterns of North-South divides and the lasting economic impact of historical boundaries, while recent changes in global fuel prices continue to reshape the transportation landscape.
Read more: What Your Salary Buys in Transportation Around the World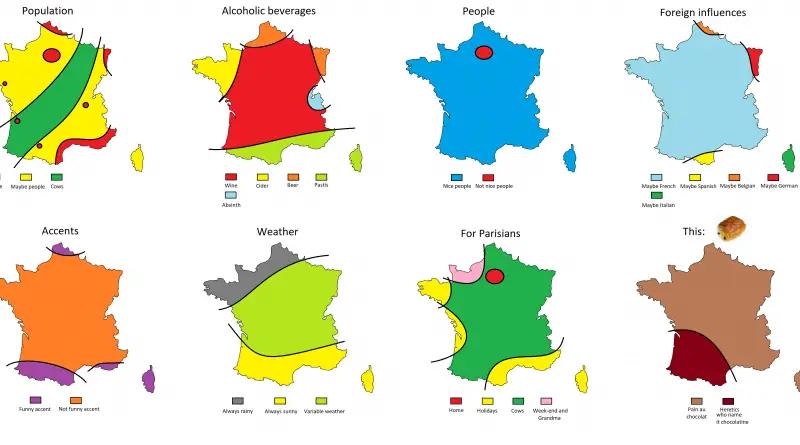
Ever wondered how French people really see their country? These playful maps expose everything from regional rivalries to pastry wars, showing us there’s more than one way to slice up France.
Read more: The Many Faces of France: From Wine Wars to the Great Pastry Debate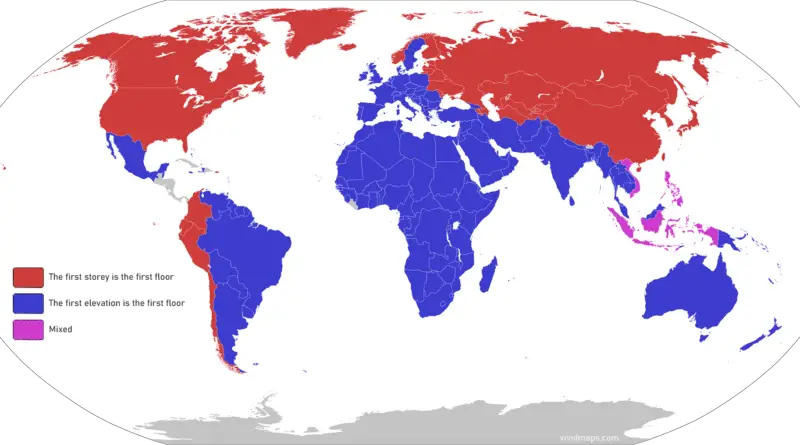
Floor numbering conventions vary significantly worldwide. In the United States and Canada, the ground floor is typically labeled as the “first floor,” with subsequent levels incrementing numerically (i.e., “second floor,” “third floor,” and so forth). Some buildings in these regions may designate the ground floor as the “lobby” instead.
Read more: Floor Counting Around the World
For the first time in its history, California’s growth story is changing dramatically. Using maps and data, we explore how America’s most populous state is transforming and what it means for its future.
Read more: California’s Population Story Is Changing – Here’s What the Maps Tell Us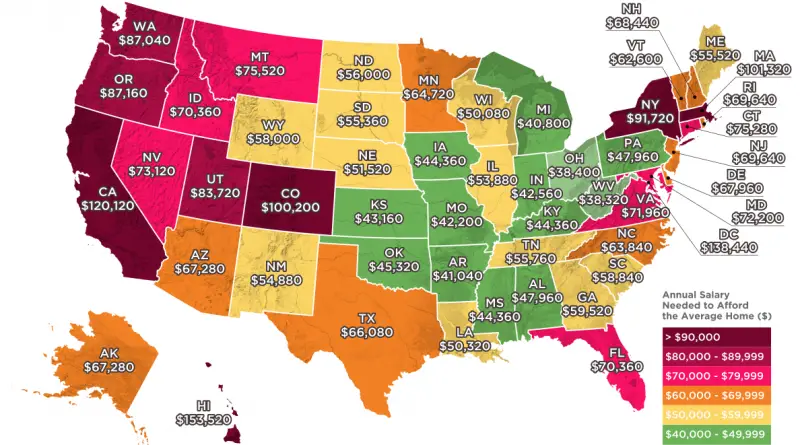
Home prices are soaring, but how much do you really need to afford a house in your state? See the salary requirements based on 2018 data and how affordability has shifted over time.
Read more: The salary you need to afford the average home in your U.S. state
Reddit user: anaconda300 Homicide rate from highest to lowest Louisiana 11.8 – Costa Rica 11.77 Missouri 8.8 – Cape Verde
Read more: Countries with similar homicide rates as U.S. states