If “Did Not Vote” was a candidate in 2016, it would have won by a landslide
Related posts: – The America That Never Wanted Hillary To Be President – Red Shift: Change in Democratic vote share
Read MoreMaps of the US

Related posts: – The America That Never Wanted Hillary To Be President – Red Shift: Change in Democratic vote share
Read More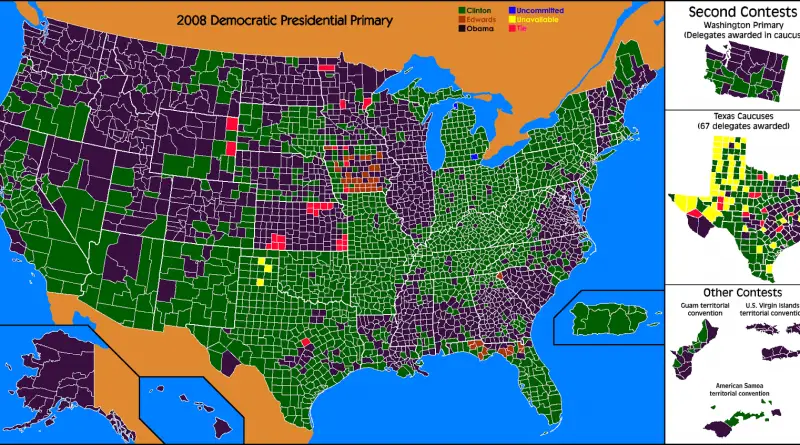
This is a map of counties that Hillary Clinton lost in both the 2008 and 2016 primaries. Hillary carried all
Read MoreRelated posts: – Red Shift: Change in Democratic vote share in presidential election (2012 – 2016) – Where each candidate
Read MoreRelated posts: – Where each candidate outperformed election forecasts – U.S. Presidential Election (2016) – How the presidential election of
Read MoreSource: fivethirtyeight.com, Google.com Via metrocosm.com Related posts: – U.S. Presidential Election (2016) – How the presidential election of 2016 would
Read More
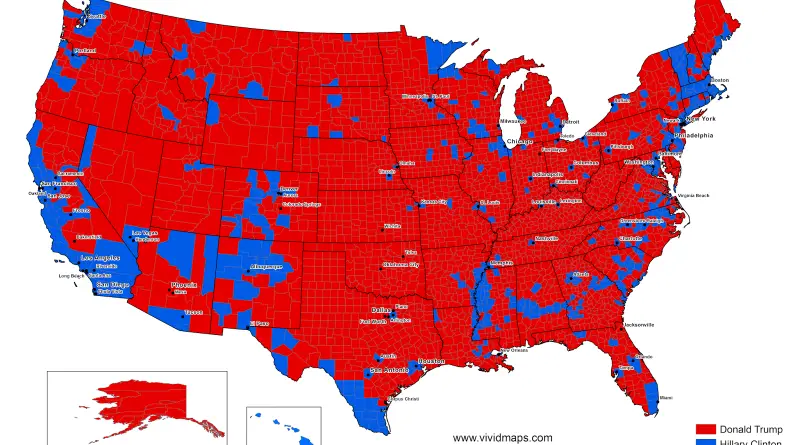
Regular election result map shows who won in which U.S county but didn’t reveal the relative voting populations among each county. It can make people think that every county has an equal population. Moreover, such maps it’s not created to display the margin of victory within each county. It shows who won in a county, even if they won by just one vote.
Read MoreSTATE DEM % REP % DIFF EV CUSTOM DC 86 4 D+82 3 DC CA 61 18 D+43 55 CA
Read MoreResults: Clinton – 218 Trump – 276 Votes: Clinton: 59,163,539 Trump: 59,027,749 Via aljazeera.com Related post: – Electoral Map Upon Trump’s
Read More