Political evolution of U.S. senate (1789 – 2018)
A closer look at the U.S. Senate’s evolution from 1789 to 2018—complete with an animated map showing political changes, long vacancies, and the structure of the chamber itself.
Read More
Maps of the US
A closer look at the U.S. Senate’s evolution from 1789 to 2018—complete with an animated map showing political changes, long vacancies, and the structure of the chamber itself.
Read More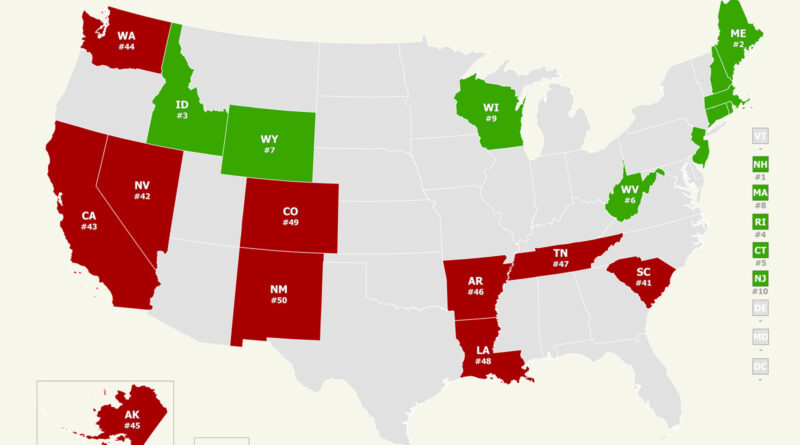
How safe is your state? Our analysis of the 2025 U.S. News & World Report public safety rankings uncovers unexpected trends across America. Through interactive maps, we discover why New England tops the safest states and some others struggle with ongoing problems.
Read More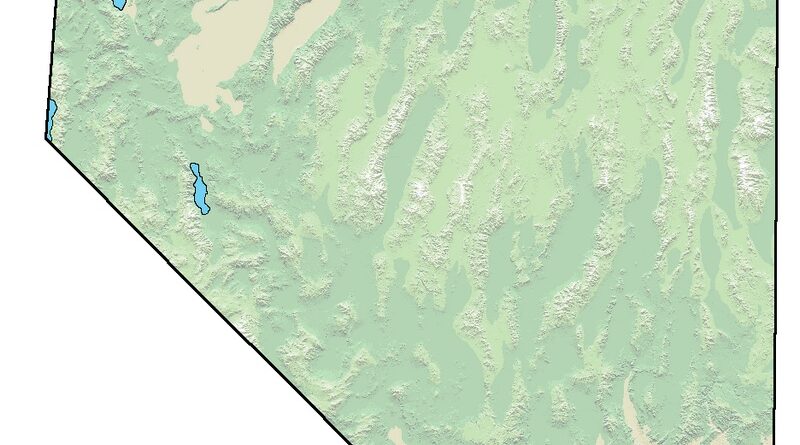
More than half of Nevada’s 3.2 million people live in the Las Vegas area, with Clark County alone housing about 2.34 million. New stats and local insights ahead.
Read More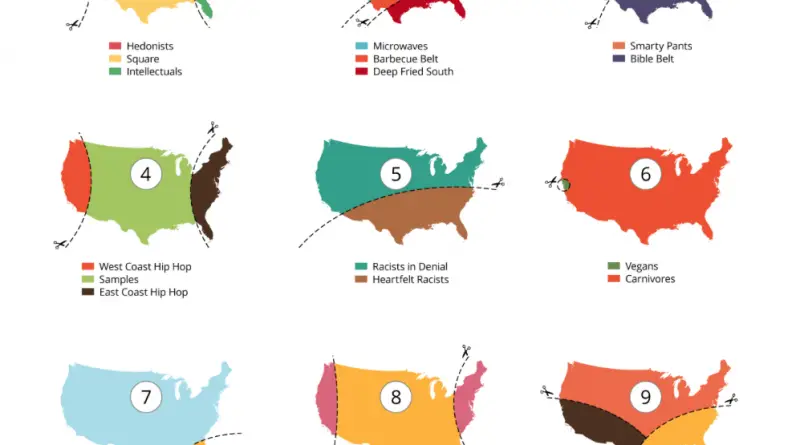
A diverse population has impacted history in the U.S. from the very beginning. From the first travelers and colonists to the modern-day, the United States has been a country of immigrants. Many groups have combined to shape America’s history and give the society that the country has today. Therefore, differences between U.S. states and territories can be significant.
Read More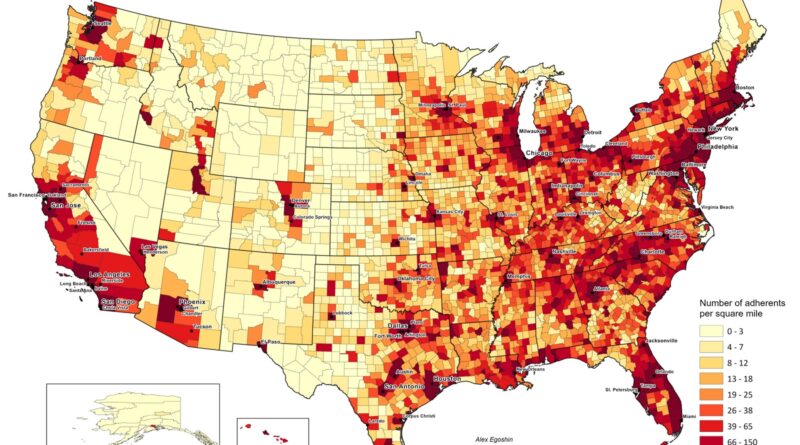
Based on ARDA’s 2020 U.S. Religion Census, about 161 million Americans are counted as religious adherents. This map shows where they’re most concentrated by land area, and an animation traces changes since 1890.
Read More
The United States is home to more than 1,100 bird species. Many states have chosen one of these birds as their official symbol. See the complete list of state birds and how they reflect the country’s rich wildlife.
Read More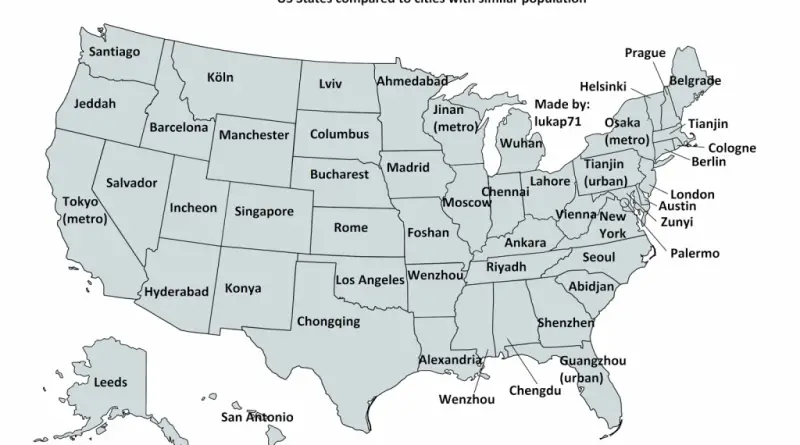
California has about the same population as Tokyo’s entire metro area—40 million people. The difference? California spreads them across a territory 30 times larger. On the flip side, Wyoming has roughly as many residents as Manchester, UK. When you match every U.S. state to a global city with similar population, the results are eye-opening. Texas mirrors China’s Chongqing, Vermont matches Helsinki, and New Jersey equals London.
Read More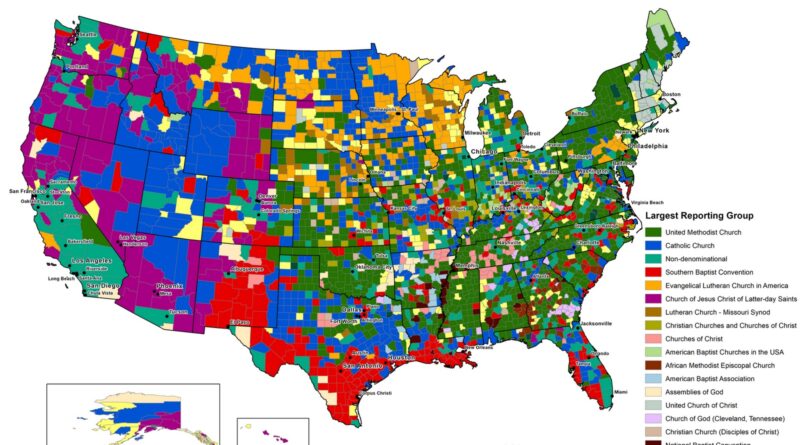
A look at the runner-up religious affiliations in each U.S. county, from Black Protestant churches in the South to Catholic and non-denominational growth in the West and cities, based on official census data.
Read More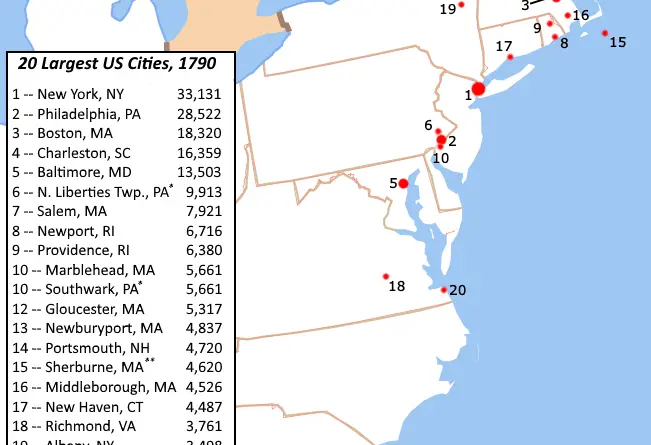
Most of America’s biggest cities in 1790 were coastal New England ports – all built around fishing, shipping, and trade.
Read More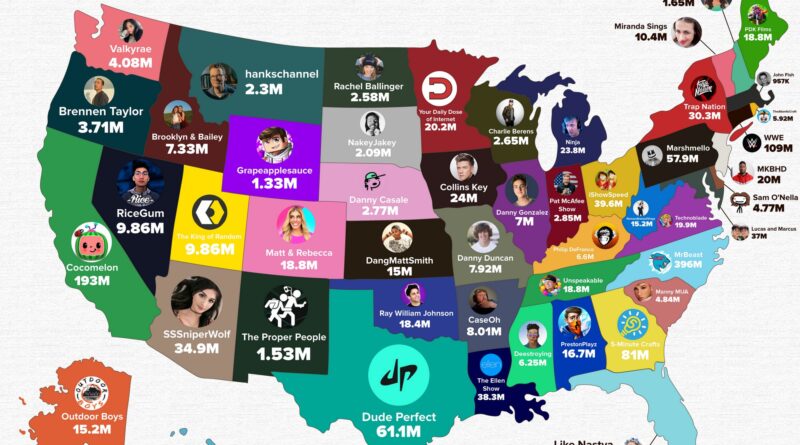
Discover which YouTube channel leads in each U.S. state in 2025. The map shows where America’s biggest creators—from MrBeast in North Carolina to Cocomelon in California—have built their massive followings.
Read More