No-Fault Evictions in San Francisco 1997 – 2017 by Neighborhood
Recently, widespread reports show that some SF property owners may be fraudulently claiming eviction reasons on rent-controlled properties to raise
Read MoreMaps of the US
Recently, widespread reports show that some SF property owners may be fraudulently claiming eviction reasons on rent-controlled properties to raise
Read MoreFacilities are often built for the “10-year” or 10% storm. Harvey has dropped a much larger amount of rain, comparable
Read More
Total religious adherents by county, 1890 – 2010 Youtube Total religious adherents by county, 2010 www.vividmaps.com Related post: – Religious
Read More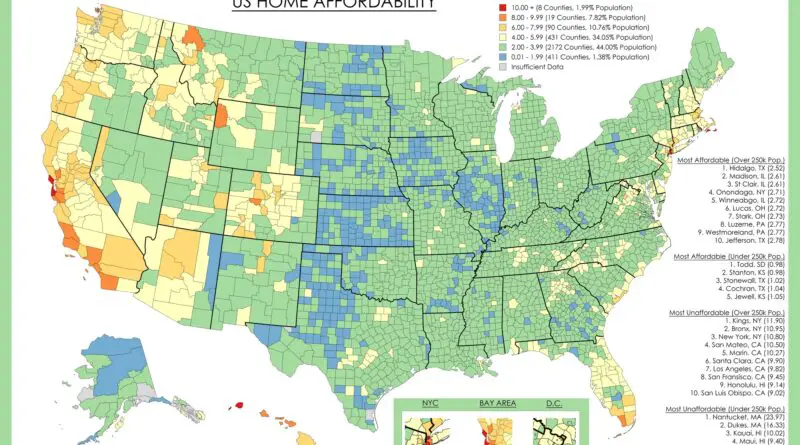
Housing affordability has become one of those topics everyone talks about but struggles to quantify. We hear about median prices rising, interest rates fluctuating, and markets “cooling” or “heating up.” But what does affordability actually look like when you map it county by county?
Read MoreReddit user: sandyisback
Read More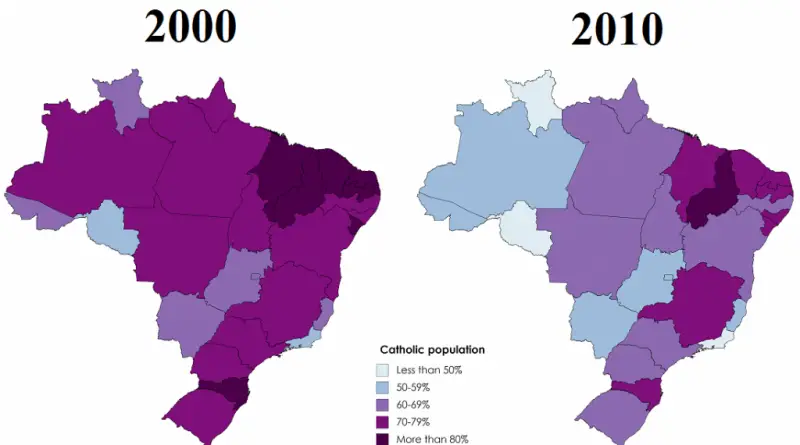
Brazil has the largest Catholic population in the world, but in the last decades, this predominance of Catholicism has been
Read More
Youtube version This map is meant to help travelers better time their trips to have the best opportunity of catching
Read More
The spatial distribution of the U.S. population is a result of a complex interplay of historical, geographical, economic, and social factors, creating a diverse and dynamic landscape that continues to evolve over time.
Read MoreThe map above shows the number of plastic surgeons per one million people. Those U.S. states in shades of red
Read MoreReddit user: eivarXlithuania Related post: – Metropolitan Areas of the U.S.
Read More