An incredible visualisation of global shipping traffic
What can I see? You can see movements of the global merchant fleet over the course of 2012, overlaid on
Read More
What can I see? You can see movements of the global merchant fleet over the course of 2012, overlaid on
Read More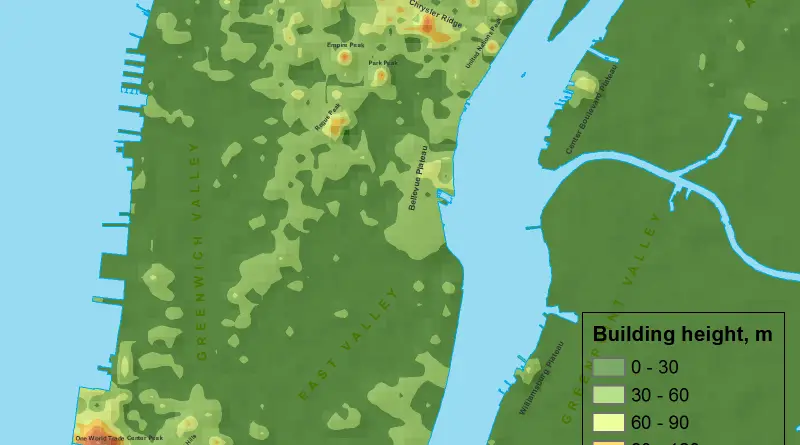
The skyline of Manhattan, New York City, stands as a testament to architectural innovation and urban development. Marked by iconic skyscrapers, the height of buildings in Manhattan is a defining characteristic of the city’s landscape. The island has been a focal point for vertical expansion, with structures reaching impressive heights that not only serve practical purposes but also contribute to the visual identity of the city.
Read More“Average Dates of Last Killing Frost in Spring,” William Reed Gardner, Charles Franklin Brooks, and F.J. Marschner (1916). “Average Dates
Read More
Relates posts: – U.S. African American population, percent increase by county – U.S. population by race – Leading group by
Read MoreThe ND-GAIN Index is a navigation tool that helps corporate and development leaders manage risks exacerbated by climate change such
Read More
Related posts: – U.S. Hispanic population, percent increase by county – Hispanic population percentage by county – Leading group by U.S. county – Leading
Read MoreRelated posts: – White Non-Hispanic population percentage by county – U.S. Population under 5 years of age percent change by county
Read More