Nazi School Map: How Nazis Claimed Germany as the Source of Civilization
Discover how Nazi educational materials used pseudoscientific maps to promote the myth of Germanic origins for all major civilizations.
Read More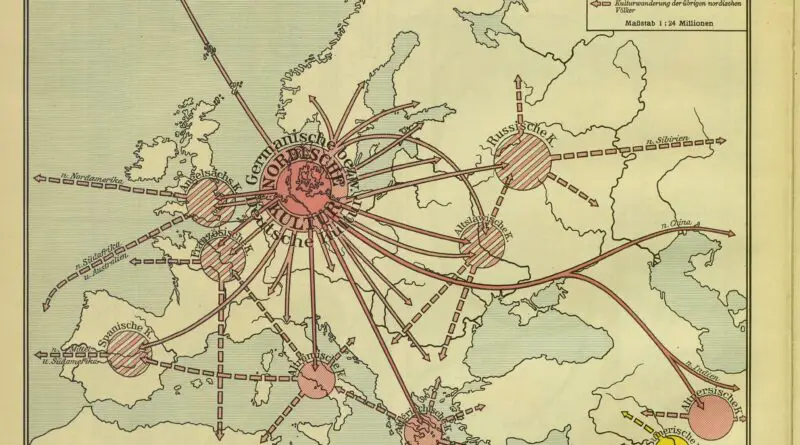
Discover how Nazi educational materials used pseudoscientific maps to promote the myth of Germanic origins for all major civilizations.
Read More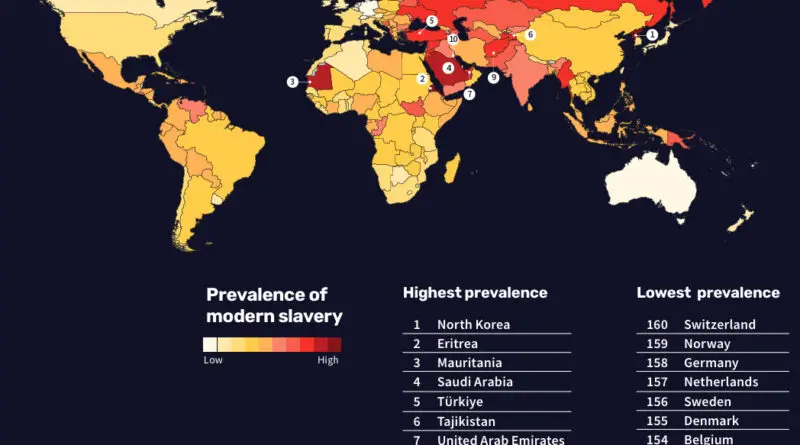
Slavery was a global system that reshaped societies across centuries, from the transatlantic slave trade to the Arab and Indian Ocean trades. But did slavery truly end? This post explores its historical reach, enduring cultural impact, and the modern fight against human trafficking.
Read More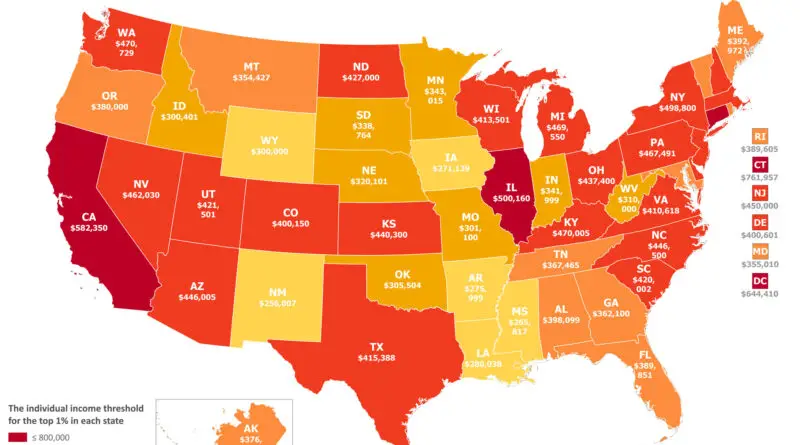
A deep dive into the financial landscape of America’s top earners, revealing the surprising income levels required to join the top 1% in different states and at various stages of life.
Read More
A fascinating 1603 map of Japan shows the emblems of major clans at the dawn of the Tokugawa Shogunate. Discover how Japan transitioned from a fractured collection of warring states to a unified nation under Tokugawa Ieyasu.
Read More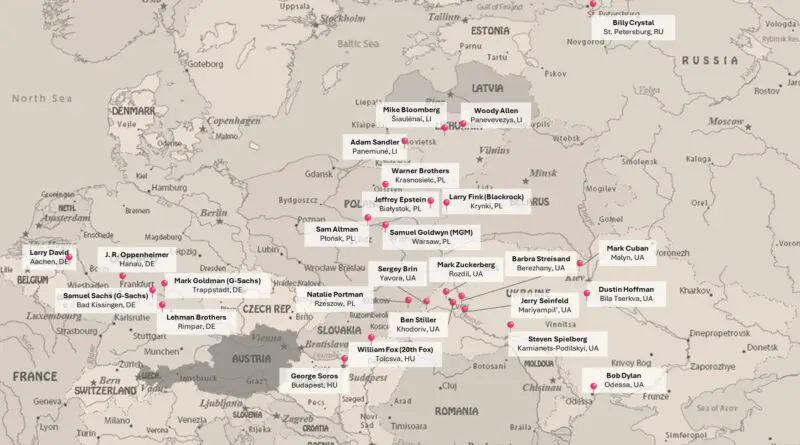
From Warsaw to Budapest, trace the ancestral origins of prominent Jewish American figures who transformed entertainment, technology, and finance. Their family journeys from Eastern Europe to America tell a remarkable story of innovation and achievement.
Read More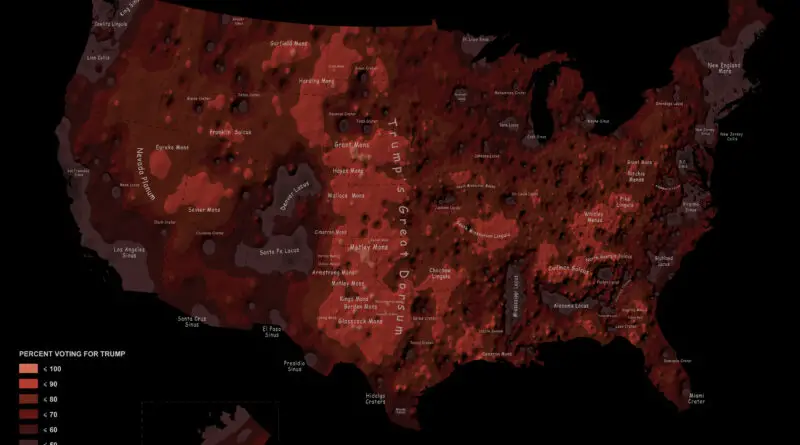
What if election results shaped other worlds? See how Trump’s votes create Mars-like peaks and valleys, while Harris’s support carves the lunar surface – revealing Earth’s political divide through planetary terrain.
Read More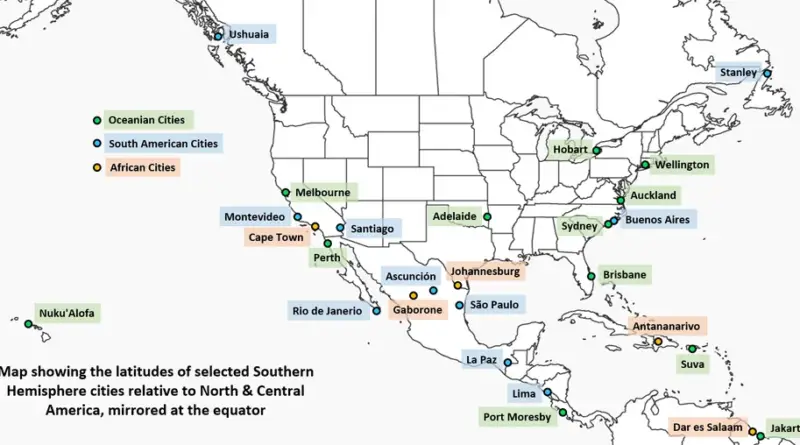
A fascinating look at how cities in North & Central America line up with their Southern Hemisphere counterparts, revealing surprising geographic parallels and climate patterns.
Read More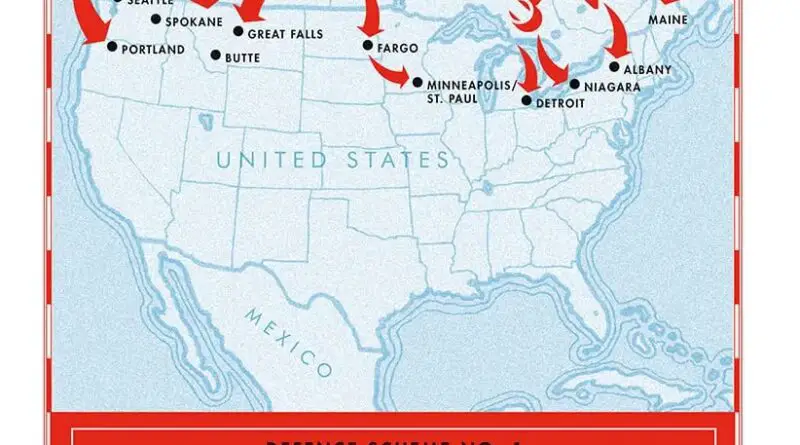
In 1921, Canadian military planners created Defense Scheme No. 1 – an innovative strategy to counter potential US invasion through tactical raids and strategic disruption while awaiting British reinforcements.
Read More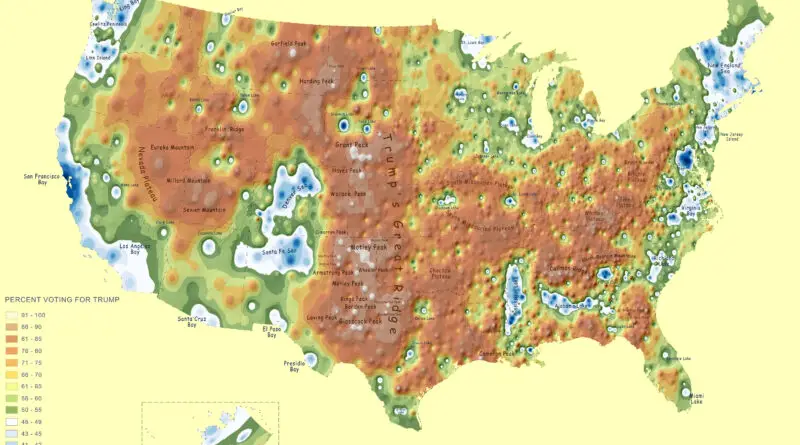
Discover how the 2024 election reshaped America’s political landscape. Republican strongholds rise as mountains, while Democratic urban centers become islands. Check the map to see how your area changed!
Read More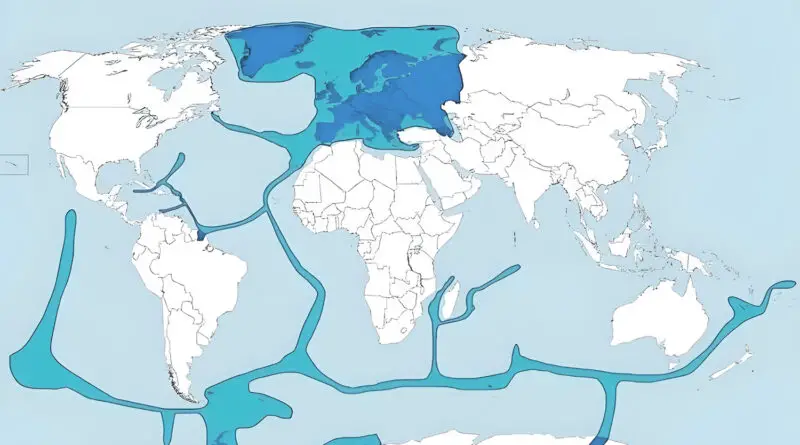
Most of us think Europe stops at its continental shores. But did you know that you can find pieces of France in the Pacific and bits of Britain scattered across the globe? Here’s the fascinating story of Europe’s truly global reach.
Read More