Demography

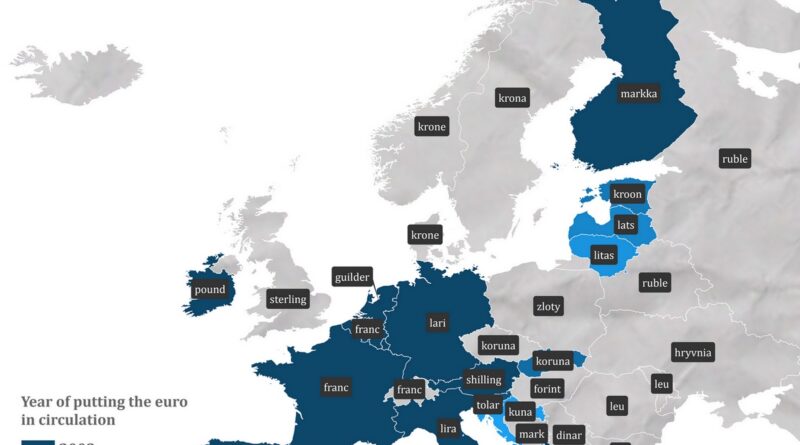
China’s Fertility Crisis: From World’s Most Populous to Demographic Collapse

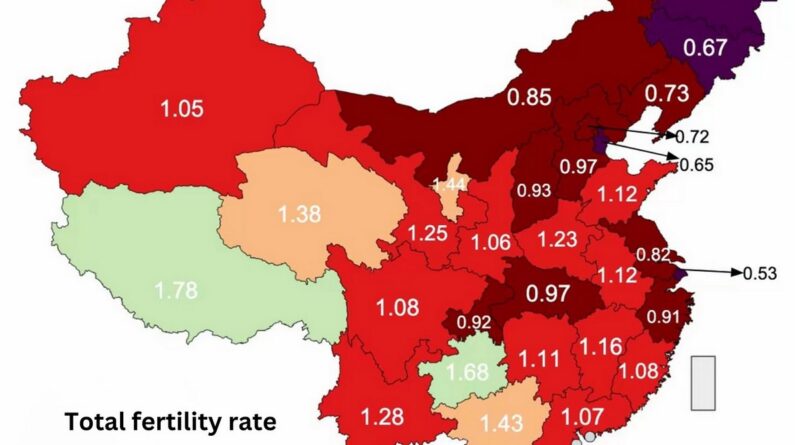
China’s fertility rate has plunged to 1.0 child per woman in 2023, with dramatic provincial variations from 1.68 in Guizhou to 0.52 in Heilongjiang. Housing costs, education expenses, and cultural shifts drive the decline. UN projections show China’s population falling from 1.4 billion to 633 million by 2100, while the U.S. grows to 421 million.

Read more: China’s Fertility Crisis: From World’s Most Populous to Demographic Collapse
Historical MapsMaps of World Religions

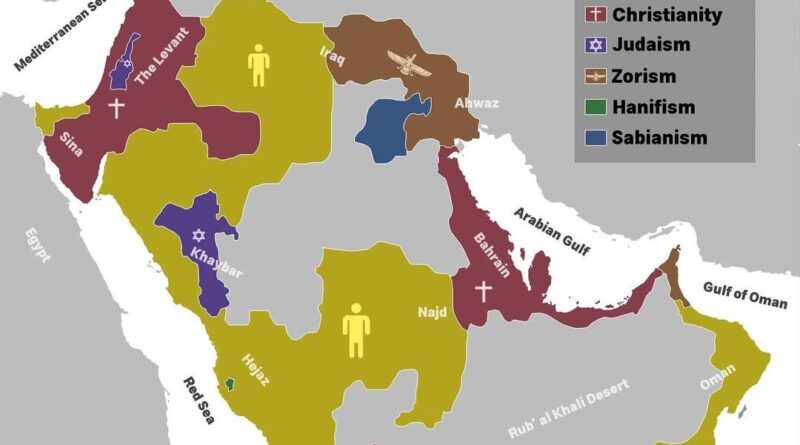
Religions in the Arabian Peninsula around the 5th century

In the early 5th century, different beliefs shared the Arabian Peninsula. Jewish and Christian families lived in busy caravan towns, while many desert tribes still honored local gods or searched for a single creator.
Zoroastrian customs from Persia reached Arabia’s northeast, blending with local traditions. A few generations later, Islam appeared and began to reshape life across the peninsula.

Read more: Religions in the Arabian Peninsula around the 5th century
ClimateClimate ChangeVivid maps

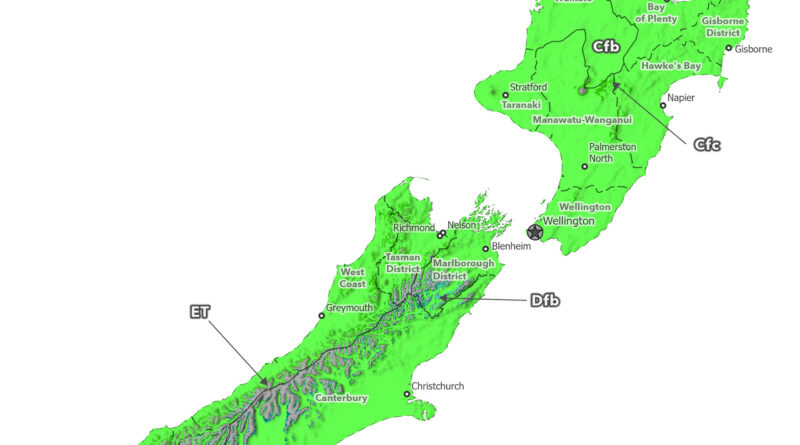
New Zealand’s Shrinking Cool Climates: Köppen-Geiger Maps from 1930 to 2099

Köppen-Geiger climate maps of New Zealand reveal mountain climate zones disappearing from 1930 to 2099. Cool-summer oceanic climate (Cfc) vanishes from North Island, tundra patches (ET) disappear from Southern Alps peaks, subarctic zones (Dfc) shrink dramatically, and cold steppe (BSk) contracts under ssp2-4.5 scenario.

Read more: New Zealand’s Shrinking Cool Climates: Köppen-Geiger Maps from 1930 to 2099
ClimateClimate ChangeVivid maps

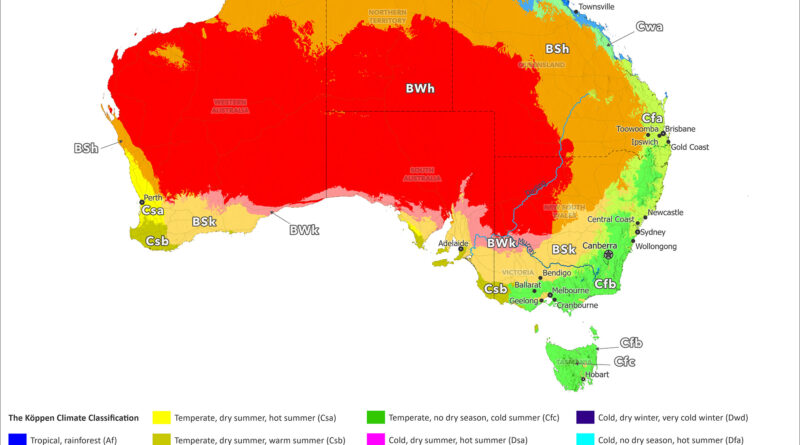
Australia’s Expanding Deserts: Climate Maps from 1930 to 2099

Köppen-Geiger climate maps of Australia reveal desert expansion from 1930 to 2099. Hot desert (BWh) and steppe (Bsh) zones spread hundreds of kilometers toward Sydney, Brisbane, Melbourne, and Perth. Habitable climate zones supporting population centers get compressed coastward under ssp2-4.5 scenario.

Read more: Australia’s Expanding Deserts: Climate Maps from 1930 to 2099
ClimateClimate ChangeNewsVivid maps

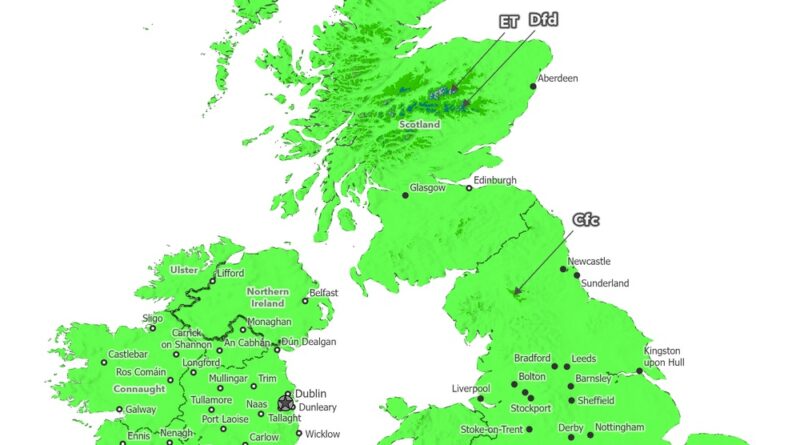
Canada’s Shifting Climate Zones: Köppen-Geiger Maps from 1930 to 2099

Köppen-Geiger climate maps of Canada reveal dramatic northward shifts from 1901-1930 to 2077-2099. Animated comparisons show tundra retreating to Arctic islands, subarctic zones moving hundreds of kilometers north, tree line advancing, and southern continental climates warming under the ssp2-4.5 scenario.

Read more: Canada’s Shifting Climate Zones: Köppen-Geiger Maps from 1930 to 2099