Cattle in religion: Hinduism cow taboo
As the cow is considered a sacred animal in Hindu, in some Indian states you can get up to 10
Read MoreMaps depicting environmental degradation across planet.
As the cow is considered a sacred animal in Hindu, in some Indian states you can get up to 10
Read MoreThe federal government and some states are considering issuing rules to cut oil and gas methane pollution from existing sources,
Read MoreMap shows the regions of the U.S. from which plants and animals will be able to escape predicted climate change.
Read More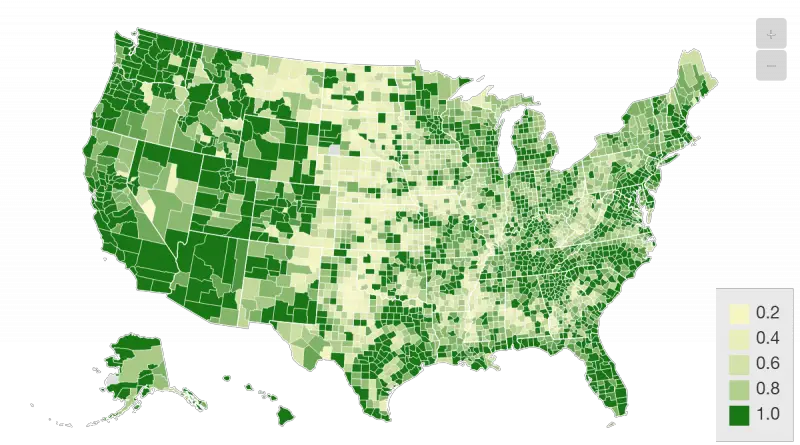
2015 population as a percent of a max population Via datawrapper The interactive map above color-codes each county based on
Read MoreHydropower produces 60% of all the electricity generated in Canada.
Read More