Mapping sexual violence (2015 – 2016)
Global violence against women and sexual violence. Each dot on the map represents a location with at least 25 articles
Read more: Mapping sexual violence (2015 – 2016)
Global violence against women and sexual violence. Each dot on the map represents a location with at least 25 articles
Read more: Mapping sexual violence (2015 – 2016)Vancouver is divided into different zones which describe the details of permitted development, use, and so forth. If you’ve ever
Read more: Vancouver zoning map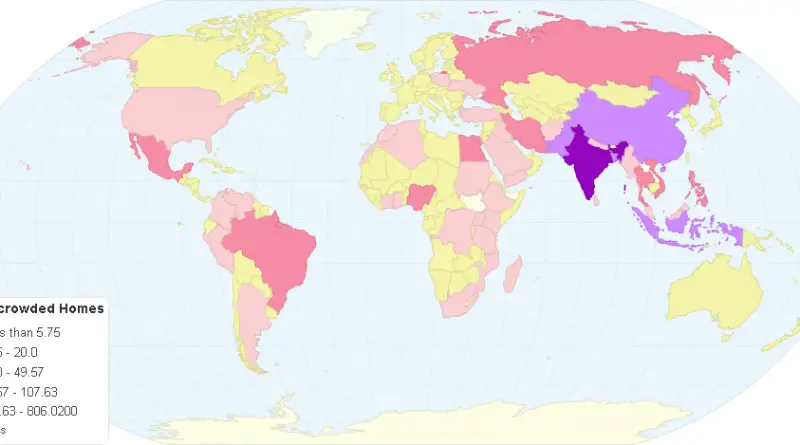
According to the World Health Organization, overcrowding refers to the situation in which more people are living within a single
Read more: Overcrowded Homes by CountryThe land surface temperature calculated by using a satellite imagery (August 24, 2016 at 4:0 3PM) and by doing some
Read more: Land Surface Temperature of TorontoThe History of South East Asia begins in the 29th Century BC when the Semi – Mythican Kingdom of Xich
Read more: History of South East Asia: Every Year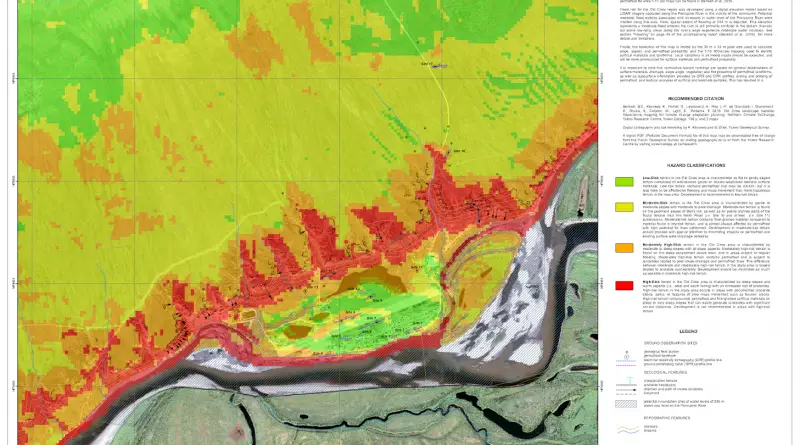
This map was produced for the purposes of landscape hazard assessment and climate change adaptation planning for the community of
Read more: Old crow landscape hazard risk map of Yukon CommunitiesUnemployment in the United States from 1990 thru July 2016.
Read more: Animated map of unemployment in the U.S. (1990 – 2016)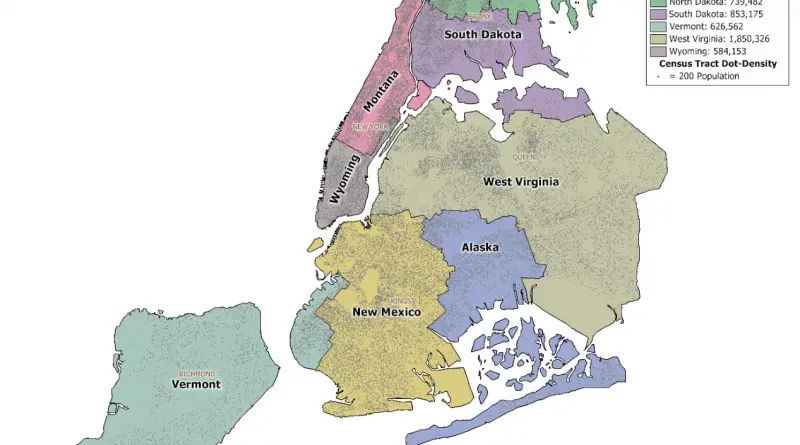
New York City is the most populous city in the U.S., with an approximated population of about 9 million spread over about 303 square miles (784 km2), accounting for over 40% of New York State’s population. New York City is the most densely populated city in the United States and the largest metropolitan area in the world by urban landmass. With nearly 20 million people in its metropolitan statistical area and about 24 million in its combined statistical area, it is one of the world’s most populous megacities.
Read more: New York City Population Mapped