Where the World’s richest billionaires live in 2015
New York City leads with 78 billionaire residents, followed by Moscow (68) and Hong Kong (64).
Read more: Where the World’s richest billionaires live in 2015
New York City leads with 78 billionaire residents, followed by Moscow (68) and Hong Kong (64).
Read more: Where the World’s richest billionaires live in 2015
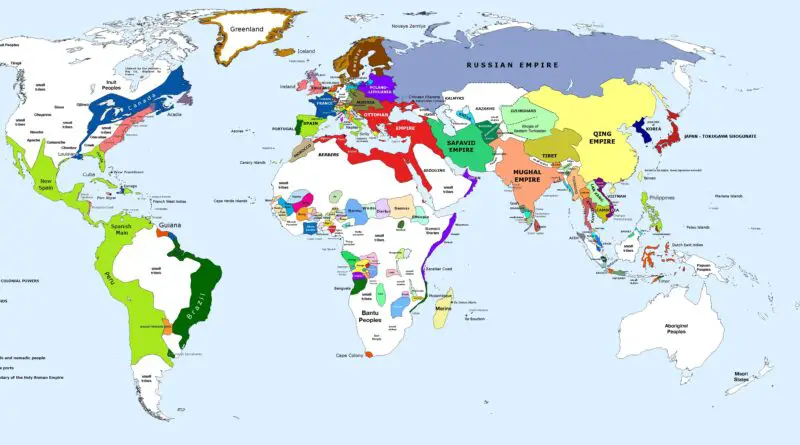
The global population in 1700 was much smaller compared to today, estimated to be around 600 million people. The dominant powers in the world were primarily concentrated in Europe.
Read more: Political map of the World (1700)Divorce is the finish of a marriage or marital union, the canceling and reorganizing of the legal duties and responsibilities
Read more: Divorce rate by countryThe ND-GAIN Index is a navigation tool that helps corporate and development leaders manage risks exacerbated by climate change such
Read more: Global Adaptation IndexThe dots below represent nearly thirty thousand towns and cities in the United States. With the input field, you can
Read more: Place Names in the U.S.Liquified petroleum gas or liquid petroleum gas (LPG or LP gas), also referred to as simply propane or butane, are
Read more: Liquified petroleum gas consumption by households by countryRelated posts: – Most disproportionately well-paying job in each state – Most disproportionately popular job for non-college grads
Read more: Most disproportionately popular job for college graduates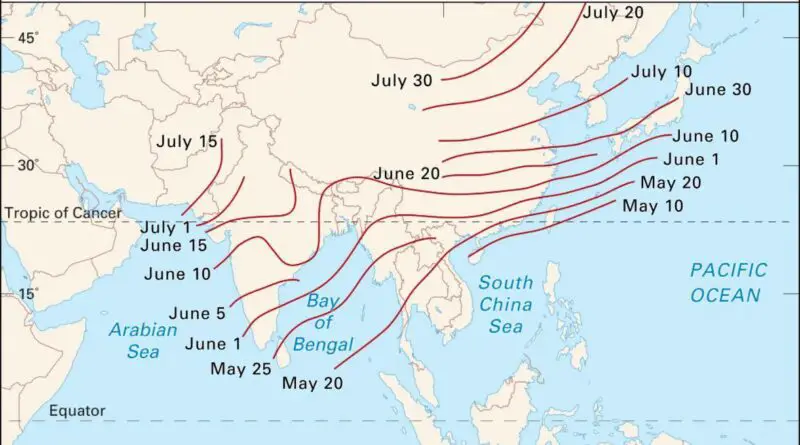
Monsoons formed on our planet due to differential heating between landmasses and oceans, coupled with the seasonal shift in wind patterns. During summer, landmasses heat up more quickly than oceans, creating low-pressure systems over land. This draws in moisture-laden winds from the oceans, resulting in heavy rainfall, while during winter, the reverse occurs, with dry winds blowing from land to sea. This cyclical pattern of seasonal winds and rainfall defines the monsoon phenomenon.
Read more: The Average Onset Date of Monsoon Across Asia MappedThis question can nowadays be answered remarkably well because precipitation figures are part of possibly the most advanced global scientific
Read more: Where does the Earth’s rain fall?The Tweet map allows you to search for the geographical distribution of words used in Twitter messages around the World.
Read more: The Twitter Search MapThis innovative dot map provides an unparalleled look at the spatial distribution of Indigenous Australians, with one dot representing each of the nearly 700,000 individuals counted in the 2011 Census. By placing every person on the map, this visualization offers invaluable insights into the diversity and complex settlement patterns of Australia’s First Nations communities.
Read more: Mapping the Footprint of Australia’s First Nations