Skip to content
VividMaps

  • Atlases
  • Map Posters
  • Scratch Maps
  • Globes
  • Videos
CitiesMapping
April 12, 2016 Alex

If downtown Vancouver was a mountain…

This map is not a strict map of Vancouver but a new representation of Vancouver through its building height in

Read more: If downtown Vancouver was a mountain… →

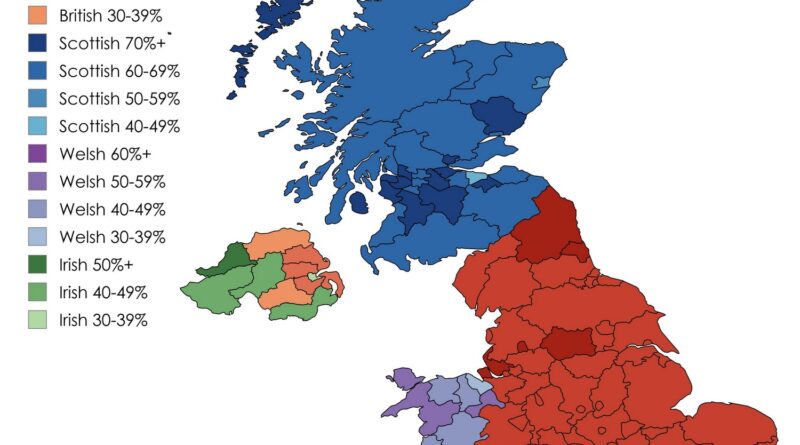
Largest national identity in the UK local authorities
Ethnic maps
April 12, 2016 Alex

National Identity in the United Kingdom

British identity tops 55% in England’s local authorities per 2021 census; Welsh at 55% in Wales, Scottish dominant in Scotland, Northern Ireland divided between Irish and British.

Read more: National Identity in the United Kingdom →
DemographyEconomic mapsEnvironment mapsMapping StereotypesPollution
April 11, 2016 Alex

Where the poor live longer

– On average, the life expectancy for a poor 40-year-old in Manhattan is 81.8 years. It is one of the

Read more: Where the poor live longer →
Environment mapsNature
April 11, 2016 Alex

Noise level from natural sources in the U.S. (excluding humans and human activity)

Read more: Noise level from natural sources in the U.S. (excluding humans and human activity) →
ChartsEconomic mapsMapping HealthSize comparison maps
April 11, 2016 Alex

Taxes as % of GDP

Denmark 51% France 45% Norway 39% Germany 36% UK 33% Turkey 29% US 26% Via oecd.org

Read more: Taxes as % of GDP →
Cultural cartography
April 11, 2016 Alex

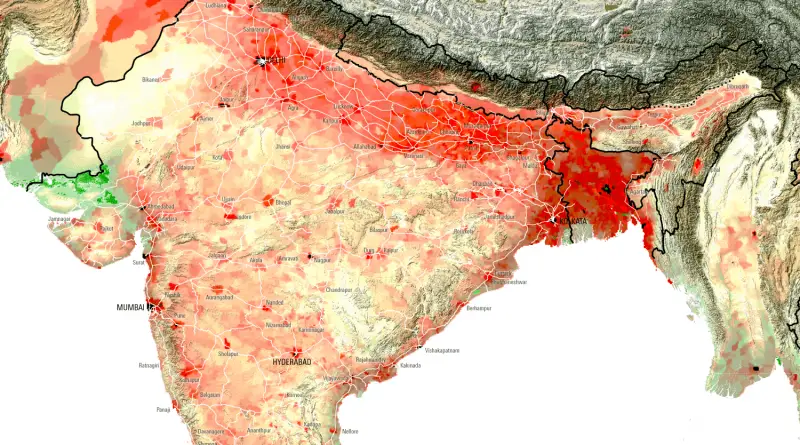
India explained in 25 maps

India is a country located in South Asia. It is the 2nd-most populated nation, the 7th-largest country by land area. Settled life appeared on the peninsula in the western boundaries of the Indus river basin 9 thousand years ago, developing slowly into the Indus Valley Civilization of the 3rd millennium BCE.

Read more: India explained in 25 maps →
CitiesCrime mapsTravel
April 11, 2016 Alex

Crime Rates in Canada: North vs South

Read more: Crime Rates in Canada: North vs South →
Crime maps
April 11, 2016 Alex

Total number of homicides per police force area

Read more: Total number of homicides per police force area →
BusinessMapping StereotypesNature
April 11, 2016 Alex

Fatal Black Bear Attacks in North America

Via www.nationalgeographic.com

Read more: Fatal Black Bear Attacks in North America →
BuildingInteractive maps
April 11, 2016 Alex

Building in the Netherlands, color coded by age

All 9,866,539 buildings in the Netherlands, shaded according to year of construction. Amsterdam Related posts: – Building Age Maps –

Read more: Building in the Netherlands, color coded by age →
GermanyHistorical MapsMapping StereotypesWars
April 11, 2016 Alex

Area under German control at of the war in May 1945

Read more: Area under German control at of the war in May 1945 →
ArcGISBusinessMapping StereotypesNaturePolitical maps
April 11, 2016 Alex

Clinton’s & Sander’s vote share as of April 10, 2016 (New York Times)

Clinton’s vote share (April 10, 2016) Sander’s vote share (April 10, 2016)

Read more: Clinton’s & Sander’s vote share as of April 10, 2016 (New York Times) →
Crime maps
April 11, 2016 Alex

Number of prisoners per 100,000 residents (2014)

Related posts: –  Imprisonment rate of sentenced prisoners under the jurisdiction of state or federal correctional authorities per 100,000 US

Read more: Number of prisoners per 100,000 residents (2014) →
Page 311 of 521« First«...307308309310311312313314315...»Last »

Trending now

  • Steel production in 1800 mapped
    220 Years of Steel Production, Mapped From 1800 to 2025Oct 18, 2026
  • Best Value Mobile Data World Map
    Maps reveal what countries have the most affordable mobile dataAug 9, 2021
  • Stereotypes about the United States
    The stereotype map of every US StateOct 29, 2015

Related Products

  • Push pin maps
  • Globe drinks cabinets
  • Maps of the United States
  • Board games
  • Monopoly
  • Map-based strategy board games
  • History Board Games
  • Coloring Books
  • Handheld GPS
  • GPS Watches
  • GPS Trackers

Vivid Maps Tools

  • Convert Latitude/Longitude
  • Elevation Finder
  • Distance Calculator
  • Kilometers to Miles Distance & Length Converter
  • Weight Converter
  • Volume Converter
  • Daylight Comparison
  • Time Zone Converter
  • Antipodes Map
  • Find cities with a similar climate
  • Find cities with a similar climate (2050)
  • How hot cities could be in 2050
  • The U.S. Population Lines

Stay connected

Get the latest maps, insights and updates delivered to your inbox.

Unsubscribe anytime.

VividMaps

Maps that explain the world.

Beautiful, data-rich maps to help you understand our world — its people, places and connections.

Explore

World map World atlas Map posters Globes

Company

About Privacy Contact

Stay connected

Follow us for the latest maps, insights and updates.

Independent WebsiteVirusScanner trust report for vividmaps.com
© 2026 Vivid Maps. All rights reserved.
A more connected world